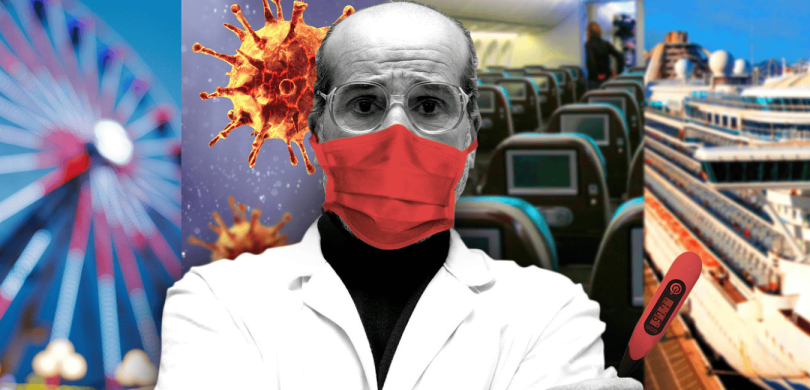
The COVID-19 stock market crash of 2020 remains one of the most dramatic financial collapses in recent history. Triggered by the sudden emergence of a global pandemic, markets around the world experienced sharp declines characterized by extreme volatility and fear-driven sell-offs.
Introduction and the Severity of the Crash
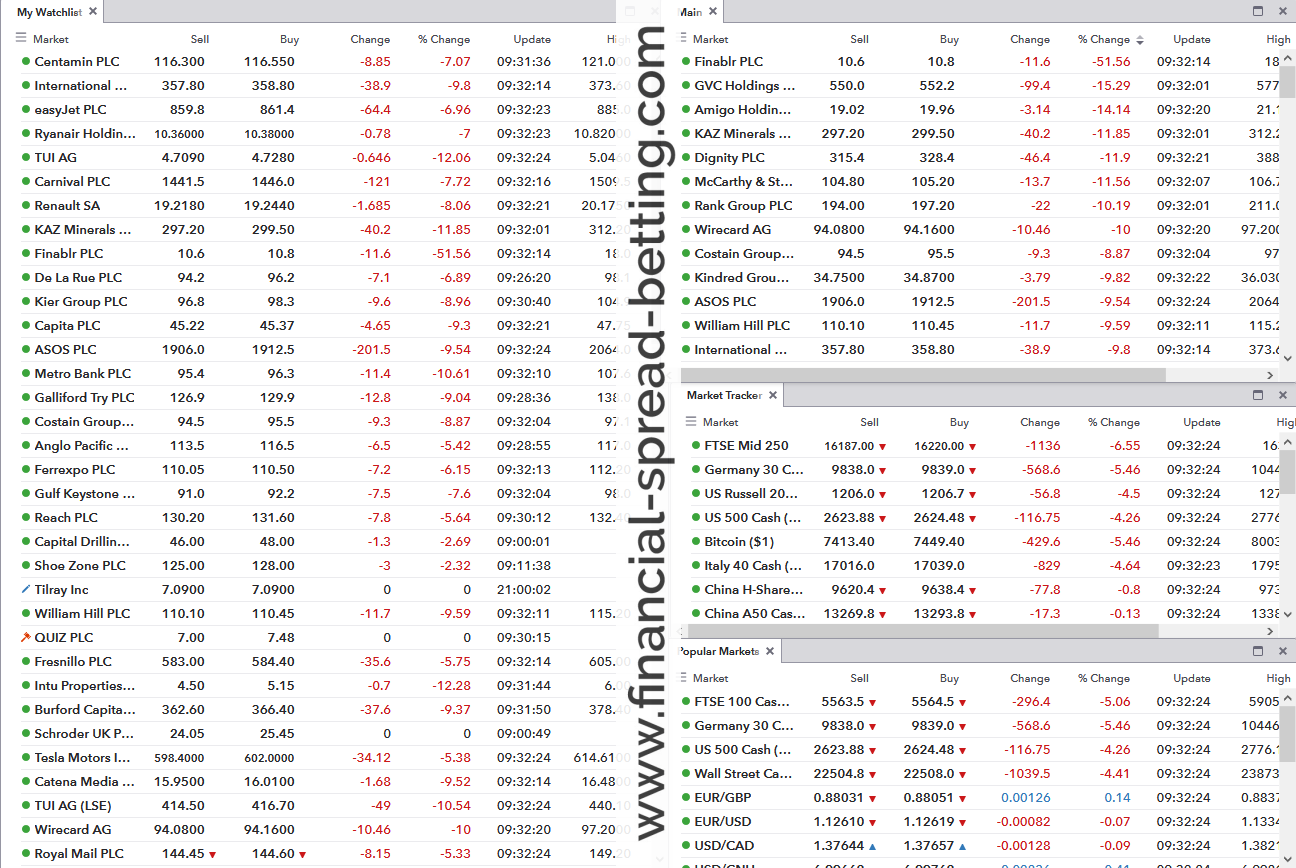
The crash began in February 2020 as news of COVID-19 spreading globally shook investor confidence. With its unprecedented nature, the pandemic led to lockdowns, travel restrictions, and widespread supply chain disruptions. Stock markets, which had reached record highs earlier that year, plummeted as uncertainty gripped financial markets. Major indices such as the S&P 500, Dow Jones Industrial Average, and FTSE 100 recorded some of their worst losses since the 2008 financial crisis. The watchlists in the images reflect this severity, showing steep declines across a broad range of stocks.
Three Images of the Crash: A Timeline of Market Chaos
The three images of stock watchlists offer a visual narrative of the COVID-19 crash, showing how specific sectors and stocks reacted at different stages of the pandemic’s onset.
- First Image (Early March 2020):
-
- This captures the initial shock when COVID-19 was declared a global health emergency. Stocks across the board begin to show sharp declines, with airlines, oil producers, and retail companies among the worst hit. The volatility is evident, but many companies still show moderate losses compared to later stages.
-
- Second Image (Late March 2020):
-
- By this point, the crash was in full swing, and panic had reached its peak. The second image highlights steeper declines across all sectors, with some stocks losing over 50% of their value. This period also coincided with the announcement of widespread lockdowns in Europe and the U.S. Fear of a prolonged recession dominated investor sentiment.

-
- Third Image (Mid-April 2020):
-
- This image shows the aftermath of the sharpest declines. Some stability begins to emerge, with certain sectors recovering marginally due to government interventions and fiscal support. However, the damage to industries reliant on mobility and physical interaction remains profound.

-
Stocks and Sectors Hit the Hardest
Certain sectors were disproportionately affected due to their reliance on mobility, discretionary spending, or in-person activity. Better examples from the provided images include:
- Travel and Leisure:
- Companies like TUI AG, Carnival PLC, and easyJet PLC saw catastrophic losses as global travel ground to a halt. Airlines, cruise operators, and holiday firms faced massive cancellations, with their revenue streams essentially drying up overnight.
- Example from the images: Ryanair Holdings PLC, a major low-cost airline, also saw significant declines as flight operations were severely curtailed.
- Energy:
- The energy sector, particularly oil and gas producers such as Royal Dutch Shell and BP, experienced a dual blow. Falling demand caused crude oil prices to plummet, and some contracts even briefly went negative. Mining companies like BHP Group, Rio Tinto and Anglo American also suffered as industrial activity slowed.
- Retail (Bricks-and-Mortar):
- Physical retailers struggled as lockdowns shuttered stores. Companies like Marks & Spencer and Frasers Group (formerly Sports Direct) experienced significant declines as foot traffic evaporated. In contrast, online-focused retailers like ASOS or Amazon thrived due to the surge in e-commerce.
- Hospitality and Entertainment:
- Stocks like Whitbread PLC (owner of Premier Inn) and William Hill (betting and gaming) also plummeted. Hospitality chains closed hotels, and major sporting events were canceled, eliminating revenue streams for these businesses.
- Financials:
- Banks and lenders such as HSBC and Metro Bank struggled due to fears of rising loan defaults and reduced economic activity.
The three stock watchlist images from that period serve as a vivid testament to the gravity of the crisis, capturing the market’s evolving response to the unprecedented economic upheaval triggered by COVID-19 on a global scale.
Government Reactions
Governments worldwide acted quickly to mitigate the economic fallout. Their actions included:
- Massive Stimulus Packages:
- In the U.S., the CARES Act provided $2 trillion in relief to individuals and businesses. European governments introduced similar programs, including furlough schemes and direct grants to companies.
- Monetary Policy:
- Central banks, including the Federal Reserve and the European Central Bank, slashed interest rates to near-zero levels. They also implemented large-scale quantitative easing (QE) programs to inject liquidity into financial markets.
- Industry-Specific Aid:
- Sectors like airlines and hospitality received direct support through loans and grants. For example, the U.S. provided over $25 billion in payroll support for airlines.
These measures helped stabilize financial markets and prevented the crisis from spiraling further.
Stock Market Behavior During and After the Crash
Initial Reaction:
The stock market’s immediate response to COVID-19 was one of widespread panic. Trading halts were triggered multiple times in March 2020 as indices fell by more than 7% in single-day sessions. The speed and magnitude of the declines reflected the unprecedented uncertainty surrounding the pandemic’s trajectory.
Recovery Phase:
From late March onwards, markets began a gradual recovery as fiscal and monetary interventions took effect. Technology stocks, particularly those in e-commerce and remote work, led the charge. Companies like Amazon, Zoom, and Microsoft became beneficiaries of the “new normal,” which favored digital and remote-first solutions.
By the end of 2020, many indices had recovered fully or surpassed their pre-pandemic highs, driven by optimism about vaccine development and reopening economies.
Conclusion
The COVID-19 stock market crash showcased the fragility of global financial systems in the face of extreme uncertainty. The three images from the watchlists provide a compelling timeline of the crash: from the initial shock to the height of the panic and, finally, the beginning of recovery. While government intervention played a crucial role in stabilizing markets, the pandemic’s impact on traditional industries like travel and hospitality remains a cautionary tale. The eventual recovery was uneven, underscoring the importance of diversification and adaptability in investing.