
Our Trader Homework series provides some key trading theory, history and analysis for traders to swot up on in their spare time. Here FX Trader Yvan Berthoux continues with his overview of the history of the British Pound…
Read part 1 below…
PART II. The trends and reversals of Cable since the End of the Bretton Wood System in 1971
Note that all the periods and important events are marked in Chart 1.

Chart 1. GBPUSD historical monthly candlesticks since 1971 (Source: Bloomberg) CLICK TO ENLARGE
A. The Nixon 1971 Shock and Smithsonian Agreements (1971 – 1973)
In addition to signing the Smithsonian agreement at the December 1971 G10 meeting, where the US pledged to peg the dollar at $38 an ounce (instead of $35 during BW) with 2.25% trading bands (instead of 1 percent), the UK also agreed to appreciate their currency against the US Dollar. The Pound was worth $2.65 by the end of the first quarter 1972.
B. 1973 – 1976: a Rough Start
However, it did not take too long for troubles to ‘come back’ in the UK and the Pound experienced a series of speculative attacks in the mid-1970s. Cable hit a low of $1.5875 in the last quarter of 1976 and the UK had to call the IMF to counter persistent runs on Sterling. This loan was followed by a series of austerity measures, which helped reduce inflation and improve the economic activity, hence boosting the pound in the second half of the 1970s.
C. 1976 – 1980: US Inflation and the Dollar Depreciation
The positive UK-US carry trade due to low interest rate run by the Fed in the mid-1970s (as a response to the post first-oil shock recession) gave birth to a four-year shining period for Cable, which recovered by 54% to hit a high of $2.45 in the last quarter of 1980.
D. The V Shape of the 1980s
I like to describe the 1980s as a V-shape curve for Cable as there were two major trends during that period. As a result of the second oil shock caused by the Shah revolution in Iran in 1979, oil prices doubled in the following year leading to a sharp increase in inflation in the US in 1979-1980 (peaked at 15% in the first quarter of 1980).
In order to reign in the double-digit inflation, Fed chairman Volcker reacted immediately by orchestrating a series of interest rate hikes that levitated the Fed Funds target rate from 10% to nearly 20%. Even though the dramatic increase in interest rates caused a painful recession and a surge in unemployment rate (11%) in the US, it eventually led to international capital inflows as high [real] interest rates became attractive to foreign investment.
What followed was a severe appreciation of the US dollar vis-à-vis the major currencies; Cable lost more than half of its value and hit a historical low of $1.0520 in the first quarter of 1985 (Chart 1). This Dollar Rise under the Reagan administration was a problem for the US economy as the current account fell into substantial and persistent deficit (Image 5a).
In addition, the US was also running large budget deficit of 5%+ during the same period (Image 5b), which put the country in a twin deficits anomaly and caused considerable difficulties for the American industry (i.e. car producers, engineering and tech companies…).

Image 5a. US Current Account in the 1980s (Source: Trading Economics) CLICK TO ENLARGE

Image 5b. US Budget Deficits in the 1980s (Source: Trading Economics) CLICK TO ENLARGE
Therefore, in order to re-boost the US economy, the Plaza Agreement was signed in New York on September 22nd 1985 and France, Japan, West Germany and the United Kingdom agreed to depreciate the US Dollar by intervening in the currency markets. This decision created a secular change in the financial market and immediately reversed the 5-year bull momentum on the US Dollar.
The Pound reacted and appreciated roughly 80 percent in the following three years. I am not sure if the [financial] sentence ‘Don’t fight the central banks’ came from this decade, but I think it is a good example to show you how much effect a central bank cohort move can have on the market.
E. 1988 – 1992: the Volatile Period
We saw a consolidation between 1988 and 1989 to $1.51 after Margaret Thatcher’s Chancellor of the Exchequer Lord Lawson decided to unofficially peg the British Pound to the German Mark (UK wasn’t in the Exchange Rate Mechanism yet (Image 8, green period). This caused inflation, a credit bubble and a property boom that eventually crashed in 1989-1990 followed by a recession.

Image 8. Exchange-rate regimes for EU members starting 1979 (Source: Wikipedia) CLICK TO ENLARGE
Cable started to recover in the first quarter of 1990 as the interest rate differential increased preference for the British Pound (Chart 3). In the middle of 1989, the Federal Reserve began to run a loose monetary policy in order to boost the US economy weakened by the Savings and Loan crisis of the 1980s and 1990s. Fed’s chair Alan Greenspan decreased the Fed Funds rate from 9.75% in March 1989 to 3% in September 1992 to boost productivity (Chart 3). Cable double topped at [perfect] resistance $2.00, a first time in Q1 1991 and a second time in Q3 1992.

Chart 3. UK Official Bank Rate (Red Line) versus US Fed Funds Rate (White Line) CLICK TO ENLARGE
It is also important to note that during that time, the Conservative government (Third Thatcher ministry) decided to join the Exchange Rate Mechanism on October 8th 1990 (Image 8, grey period), with the pound set at DM2.95.
16 September 1992: Black Wednesday and ERM exit (Source: Inside the House of Money)
Also called [another] Sterling crisis, the British government was forced to withdraw the Pound Sterling from the ERM on that day, sending the pound into a free fall. Cable tumbled by 30% from [Q3 92] peak to [Q1 93] trough. But what really happened then?
As we mentioned before, the UK tardily joined the ERM in 1990 at a central parity rate of DM2.95 and a trading range band of +/- 6 percent. The exchange rate was arguable judge too strong by many economists at that time, therefore the overvalued currency in addition to high interest rates and falling house prices led the country into a recession in 1991. It became difficult for UK officials to maintain the value of the Pound at around its target against the Deutsch Mark.
Meanwhile, Germany was suffering inflationary effects from the 1989-1990 Unification, which led to high interest rates. Therefore, despite a recession, the UK was ‘forced’ to keep interest rates high (10% in September) to maintain the currency regime. Speculation began and global macro traders (i.e. Soros) increasingly sold pounds against the Deutsche Mark.
To discourage speculation, UK Chancellor Lamont increased rates to 12% on September 16th with a promise to raise them again to 15%. However, traders continued to sell British Pounds, as they knew that increasing rates to defend a currency during a recession is an unsustainable policy.
Eventually, on 16 September 1992, the UK government announced that it would no longer defend the trading band and withdrew the pound of the ERM system. The Pound lost 15 percent of its value against the DM in the following weeks and traded as low as DM2.16 in 1995.
Even though we usually do our analysis of a specific currency vis-à-vis the US Dollar, I thought it was important to mention the presence of the Deutsch Mark as it explained Cable’s depreciation in 1992 and 1993.
F. 1993 – 1998: the Dull Period with Shy Sterling Gains
After the ERM exit, it was dull period for the USD/GBP, Cable oscillated around $1.60 with a shy little upward trend (i.e. shy GBP gains) helped by the small interest rate differentials and a series of trade balance surpluses. It looks like the $1.70 psychological resistance was hard to break between 1996 and 1998 and the Pound traded within a ‘tight’ 10-figure range during these years.
One important event during that period was that the Monetary Policy Committee was given operational responsibility for setting interest rates in 1997 with one [only] mandate: maintain a 2-percent inflation rate in the long run. Traditionally, the Treasury set interest rates.
G. 1999 – 2002: The Sterling Depreciation
As we saw for the Euro (and the Yen at a lesser extent), the turn of the century was marked by a Dollar appreciation between 1999 and 2002. Cable lost a bit of steam during that period and spent a lot of time flirting with the $1.40 support in 2000 and 2001 (it even hit a low of $1.37 in Q2 2001). I have not found any supportive literature to explain this downward bias, but it is not absurd to assume that some of the Dollar strength came from a surge in the equity market capitalization in the US – with the Tech Boom – and potentially a higher productivity than in the United Kingdom.
H. The 2002 – 2008 GBP Appreciation (or US Dollar Depreciation)
The US Dollar started to tumble in late 2001 / early 2002, which was the beginning of a 6-year bull period for Cable. The exchange rate went north 50% and reached a high of $2.11 in the last quarter of 2007 (with a small consolidation in 2005). The (inflation-adjusted) trade-weighted dollar exchange rate (i.e. see REER) steadily depreciated, falling by roughly 25 percent (Image 6).
During that period, US was printing persistent twin deficits: Current Account deficits print a high of 6 percent in 2006 (Image 7a) while Budget deficits were ranging between 2 and 3.5 percent as a share of GDP (Image 7b). In addition, the Fed decreased interest rates to 1.75% after the 9/11 attacks and then to 1 percent in 2003, helping the government to roll its debt at lower costs and finance the Iraq War (total cost to the United States was at 3 trillion USD according to Stiglitz and Bilmes, 2010).

Image 6. US Dollar REER (Source: OECD CLICK TO ENGLARGE

Image 7a. US Current Account in the 2000s (Source: Trading Economics) CLICK TO ENLARGE
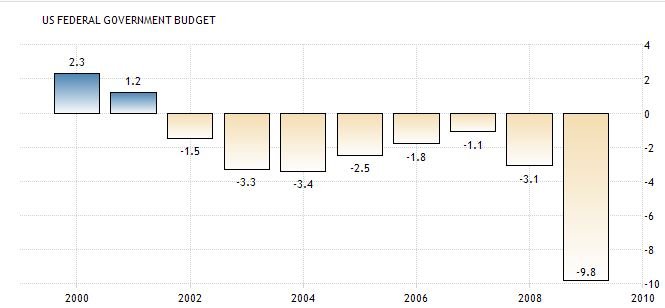
Image 7b. US Budget Deficits in the 2000s (Source: Trading Economics) CLICK TO ENLARGE
I. 2008: Financial Crisis and the Risk-Off Aversion
The British Pound saw a massive depreciation in 2008 due to the risk-off sentiment and the sudden demand for Dollars; Cable tumbled 36%+ from [Q4 2007] peak of $2.11 to [Q1 2009] trough of $1.35. In the early 21th century, Sterling had lost its reserve currency for a long time, so when asset prices took a massive hit in 2007-2008 the pound did too. The two currencies that acted as ‘strong’ safe-havens were the US Dollar and the Japanese Yen.
This raised an interesting debate on whether countries should have huge amount of debt (denominated in their local currency) in order to have a currency that acts as a safe-haven in harsh period. When you think about it, the two safe-havens are the currencies of the two most indebted nations ($20tr for the US and $11tr for Japan, as of today).
The UK was sharply impacted by the crisis; to give you an idea, the Pound’s [36-percent] fall vis-à-vis the US Dollar wasn’t even enough to make up for weakening foreign demand. It took the country’s economy 6 years to come back to its pre-crisis level (summer 2014, ONS), with a debt-to-GDP ratio that soared from 51% in 2008 to 89% in 2014.
Bank of England’s answer: Like many other central banks, the Bank of England slashed rates from 5 percent in the beginning of 2008 to 0.5% in Q1 2009 (the lowest since the BoE establishment in 1694). In addition, the Bank of England press the QE bottom like in the US and created £375bn of new money between 2009 and 2012.
The series of measures adopted by central bankers brought back interest in the Sterling Pound, considered to be ‘cheap’ or undervalued relative to its peers. Cable regained 50% of its value in three quarters and hit a high of $1.71 during the third quarter of 2009; however, the recovery wasn’t very long as the Sovereign debt crisis emerged in Europe (at that time is was Greece) and impacted the British economy (and its currency) as well.
J. 2011 – Summer 2013: the Other Dull Period
Bizarrely, the British Pound wasn’t affected too much during the [second] EZ sovereign debt crisis between Q3 2011 and mid-2012. For almost two-and-a-half years, Cable traded around $1.50-$1.60 with pressure on the downside in the beginning of 2013. The pressure came after it lost its top AAA credit rating for the first time since 1978 on expectations that growth would ‘remain sluggish over the next few years’.
At that time, traders were starting to predict that Cable would retest its 1.40-1.4250 support range as the Pound was clearly not a hot currency in the beginning of 2013. In addition, investors were also starting to look at the Euro’s momentum after the buy-on-dips that followed Draghi’s ‘Whatever it takes’ in July 2012.
Despite the UK weakness, the British Pound didn’t fall to further levels as it was ‘saved’ by a dovish Fed and a US Dollar in the coma. In the last quarter of 2012, Bernanke announced a further round of QE with monthly purchases totalling $85bn (of Treasuries and MBS) in order to boost productivity. This prevented the British pound of depreciating too much and raise interest in the cheap Euro at that time.
K. August 2013: New BoE Governor Mark Carney took office and the Pound experienced a fantastic year
In the summer of 2013, Mark Carney left the Bank of Canada to take over Mervyn King’s place as the new Governor of the Bank of England. What followed was a series of good news and positive fundamentals in the UK; the British Pound switched from the no-interest status to traders’ favourite currency (with the Euro, there were the market’s darlings).
Cable soared from its $1.48 lows to hit a 6-year high of $1.72 with market participants pricing in a sooner interest rate hike. Cable’s good driver of that one-year bull period was the increase in implied rates [looking at the short-sterling futures contract]. Moreover, Britain was the fastest-growing major economy in 2014, printing an annual growth of 2.9% (surpassing the US and its 2.4%).
L. Summer 2014: the Dollar wake-up and the start of a Bear currency market for the Pound
The last positive words on the British economy came out of Carney’s mouth during a speech he gave at the Mansion House on June 12th 2014 (the same night of the kick-start of the World Cup in Brazil). He said that the UK was on a positive momentum (i.e. fundamentals were good) and hinted that the Bank of England may rise rates sooner than the market expected. At that time, I remember that the futures market was pricing in a 25bps hike by the end of Q4 2014.
However, everything vanished a few weeks later and more and more participants were starting to notice that the British pound was showing signs of ‘fatigue’ and that a consolidation was coming. In addition, May 2014 was also the announcement of the ‘Euro’s Death’ and that the single currency expected depreciation may spur an overall Dollar strength. And it happened… According to the DXY index, the Dollar strengthen by 25 percent against its main trading partners between July 2014 and March 2015. Cable tumbled from a $1.72 to $1.4635 during that same period.
In early 2015, most of the market participants was pricing in another 15 to 20 percent increase in the Dollar on expectations of the Fed starting a tightening cycle (taking the two previous Dollar Rally that we described earlier as empirical data: the Reagan Rally in the beginning of the 1980s and the Clinton Rally that occurred in the late 1990s).
2016: The Brexit Effect and Monetary Policy Divergence
After a brief pause in 2015 as the Fed halted its tightening cycle [due to the sharp sell-off that occurred in the beginning of 2016], Cable continued its bear market against the US Dollar in 2016 on speculation of a Brexit Yes vote first (in favour of leaving the EU), and then on the concretisation of the Yes vote (52% in favour of Brexit) following the referendum held on June 23rd. The pound traded below the 1.20 level against the greenback after the announcement, its lowest level in 21 years, and remains currently under pressure as Brexit uncertainty will continue until Article 50 gets triggered.
BoE answers to Brexit
After four years of status quo [and hints of potential rate hikes], the Bank of England announced a new round of QE in August 2016, targeting £60bn of monthly purchases (of which £10bn of corporate debt) and cut its Official Bank rate by 25bps to 0.25%. With the Fed now [seriously] reconsidering starting a tightening cycle after a first hike last month and three potential rate increase in 2017 (DotPlot Gradual Path), the monetary policy divergence between the US and UK and the political uncertainty in Europe (and UK) will weigh on the Pound in the near future.