
In the following examples, identify each of the four key features of good short candidates.
- Distribution over an extended time period.
- A pattern of lower tops and lower bottoms.
- A clear sign of weakness.
- A weak rally to overhead resistance.
Below: Is the clearest opportunity to short at the high in this chart? If not, where?

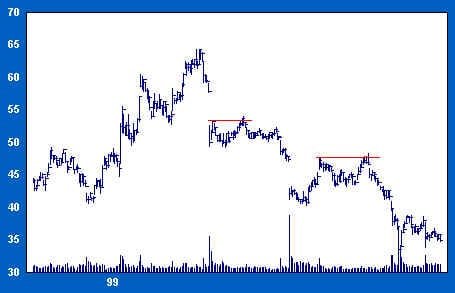
Below: Once the price breaks down from the top, is the opportunity to short gone? What is the best point to establish an initial short position? Where should the short position be increased?
Below: This stock exhibits an axis about which distribution takes place. How does the axis help to define levels at which shorts should be placed?

Below: Where is the sign of weakness? Where should the initial short be taken? Are there other well-defined opportunities to sell short? How many?

Below: What should you watch for now?

Below: How does the reverse use of trendlines help to identify a sign of weakness?

End of Basic Training