
Charts
Mention charts to most people and they begin to think of pie charts, graphs etc. and school. Instantly the dread factor creeps in before we have even seen one and we instantly begin to think that we can’t read the damn thing and what’s the point of it all anyway. I hope that you’re not like that, but I do understand totally why you may be like that. I was like that initially before I discovered what was exciting about a chart!
Well without sounding as if I need to get out more (and maybe I do), when someone shows me a chart I instantly begin to look for familiar patterns. We will be talking about Technical Analysis, looking for familiar patterns that signal price movements, later. For now we are going to get used to what charts are and how we should read them. After all it would be pointless for me to talk to you about charting etc. if you didn’t know exactly what I was talking about. Sadly many websites assume that we all have a degree in business and mathematics and therefore present their content in such a way that you need a million degrees to understand what they’re talking about. The main focus of this website is to teach people not only a technique that really does work, but more so in a way that most people can understand and relate to. Not in a pompous, aren’t we clever way, which sadly seems so common today and is partly responsible for the ‘Smoke Screen’ that the institutions want to throw, to prove how difficult it all is. Also, to the same degree many trainers within this field like to give the impression that by spending 1000’s on their course you will learn something different, secret and hidden – rubbish! We all know the same techniques pretty much, no one has found any magical secret. What most seminars teach, is a fraction of what’s covered in these modules and what is also available to you online as a private student of my website, yes that’s a plug, but then I am not charging thousands, unlike some.
Once you’ve read these modules and practiced a few trades, you will quickly realise how full of bull some of these training guys are.
Back to the plan Batman! OK. So what is a chart? Well, simply put, a chart shows in graphical form the price movements over a given date range. The information contained in these charts is very adaptable and if you’re not even a little bit versed in what they mean, you would be tearing your hair out and giving up very quickly indeed.
Let’s look at the following chart. Now it may look complicated, but really it is very simple. We will start with just the basic information to begin with so that you can become familiar with how charts work etc., before we start adding the tools that we use to look for price movements. That will come later. I just want you to become comfortable with working with charts etc.
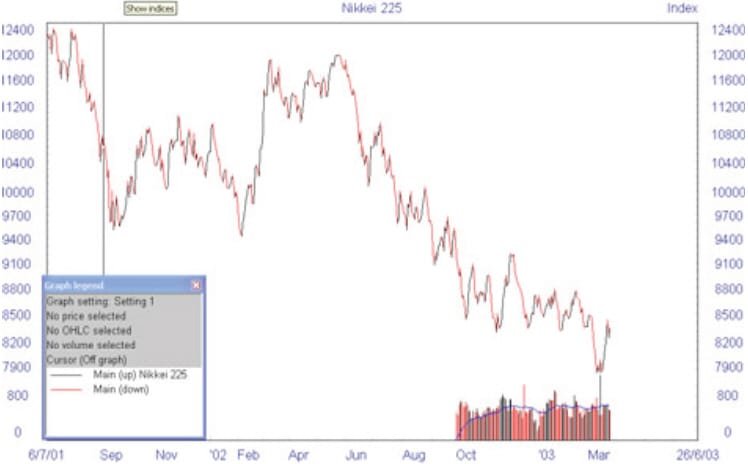
Look at this chart we can see the main price line which depicts the value of the share over a given period. The date range chosen for this chart is shown running along the bottom of the chart. The value of the share is Plotted from left to right by a simple black line – sometimes, as in the case for this chart a black line is used for a price movement that is going up and red when it is going down. This line as you can clearly see fluctuates and this is the price movement over time.
You can grasp instantly an idea of the value of the share by looking at the price line and looking to the left or right to see the value, then looking at the date that’s in line with where you are looking on the chart.
The software that I used to show you the charting examples in these modules is a package called Sharescope which is exceptional value and easy to use. Needless to say there are many other companies that offer similar packages, some are on the Internet only, some are downloadable. There are many to choose from.
However, the majority of the price movements that you see and in fact pretty much any chart you will ever see, has little relevance to real company events. It’s mostly based on rumour and speculation, no one really knows. Well apart from the owner of the company, but then they have to be very careful buying shares in their own company and there are strict rules that they have to follow. If they have been found to have an unfair advantage on a share movement that they could have known about, then they get sent to prison for ‘Insider Trading’. I am sure all of us can recall stories of Directors getting into trouble with this. Although, I must point out that to prove the Director was involved in ‘Insider Dealing’ and is very hard and most cases fails.
So the prices that we see are based on the whim of other traders’ faith in that company and share. That’s all it is. What you are seeing there is mass crowd psychology in action, nothing more. The great thing that you are going to be learning is that this mass psychology creates patterns in charts. That once you’re shown what to look for and what signals to take note of. You can judge where prices maybe in the short to medium term. I will be talking more about Technical Analysis later. For now I want you to get used to reading some charts.
What I want you to do is go to a charting service, whether that’s the member website or one of the very basic charting services that you can find for free, a good place to look at is www.ft.com. Select some charts of companies that you are familiar with. Now don’t worry about some of the additional lines and graphs that may appear. I want you to get used to selected date ranges and looking at the price fluctuations and reading the data accurately. If you know of a company that has recently been in the press for good or bad reasons, then have a look at their chart and see how the price fluctuates before and after news. I think you may be surprised to see how in fact that the company’s real value has little to do with that of the value of the stock price.