Market Trends
When trading forex there are two main types of market that it is important to be able to remember and recognise. The first is known as a Broad Range Consolidation Market, or simply a range bound market. Trades in a Broad Range Consolidation Market tend to fall between two fixed points without fluctuating to new highs or lows. Broad Range Consolidation is not limited to timescales and can be applied to a minute range time scale or a monthly range timescale. In both cases the range would not falter and would remain within the same boundaries irrespective of whether that is for hours, days or months. Broad Range Consolidation Markets only change trend when something major happens to affect global economy, such as war or a natural disaster.
The other type of market is known as a Trending Market. Like a Broad Range Consolidation a Trending Market can be measured in different time scales. Unlike a Broad Range Consolidation Market a Trending Market fluctuates between new highs and lows. Traders can be more susceptible to loss when trading on a Trending Market. For example when a Trending Market plummets suddenly those who have traded short will profit, whilst those with long trades will lose out or be stopped out. To avoid losing out on a Trending Market it is advisable to follow the pattern of the trend.
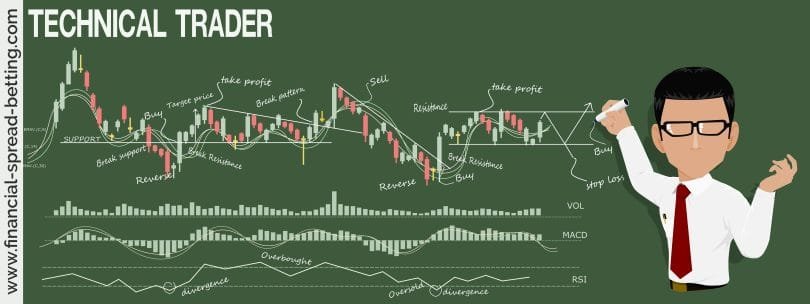
Charts can be drawn as candlesticks that represent both Broad Range Consolidation and Trending Markets showing points of resistance and support. Both types of market can be measured in terms of minutes, hours, days, weeks etc. Most charting applications allow the trader to choose the time scale they want to look at. It is recommended to look at long-term trends initially as this will give you more of an idea as to the type of market and type of trend being followed. Charts that demonstrate shorter timescales are good for closer analysis of a long-term trends but are not ideal starting points. A longer-term trend is more established with any unexpected peaks or troughs worth noting, a shorter-term chart that shows a dip after a few minutes isn’t worth getting excited about as a chart that has followed the same pattern for twelve months or more and has then dipped.
The Support and the Resistance points in a trend are simply the lowest point and the highest point that trend has reached, with the Support being the lowest point and the Resistance being the highest point. Support and Resistance are sometimes known as the floor and the ceiling of a trade. It is easy to remember that the floor is the support level, and the ceiling is the resistance. Like a house the floor supports the framework and the ceiling prevents or resists you from going any higher. The Support and Resistance points within a Broad Range Consolidation Market remain the same unless there are major upheavals in the global economy as mentioned above. A trending market can have new points of Support or Resistance. When a new point of Resistance is reached the previous point of Resistance becomes the new floor or Support point. To establish the line of Support simply connect the lowest points and draw a line to form the support line. If the lowest point changes then the line needs to be redrawn to incorporate the lowest point. If the trend plunges unexpected this is breaking the trend and is not included in the support line. To draw the line of resistance simply connect the highest points with a line. Once again if the market trades above this line this is breaking the trend and doesn’t need to be included within the line.
Trading Styles
Day Trading is a style of trading that relies on being able to analyse intra-day data. Charts with a short time scale representing minutes or hours are used. The trade is not continued overnight and closes at the end of a trading day. This can be quite complex and difficult to analyse and is best employed by experienced traders only.
Swing trading can be used for trades with various time scales ranging from hours and days to one or two weeks. The type of chart used varies from an hourly chart upwards.
Position trading is trading over a longer period of time than swing trading. Position trading can be based on weeks or months.
Long term trading uses charts based on longer periods of time such as weekly or monthly. It is advisable to use longer- term charts when beginning trading.
Carry trading is trading based on interest rate changes and typically is takes years.

