The Technical Analysis chart patterns that I use in order of importance, to me, are as follows:
- Support & Resistance
- Triangles
- Head & Shoulders
- Bounce/Retrace
Support & Resistance
Support and Resistance is one of my favourites and one, which you will see me regularly draw on a chart.
Support
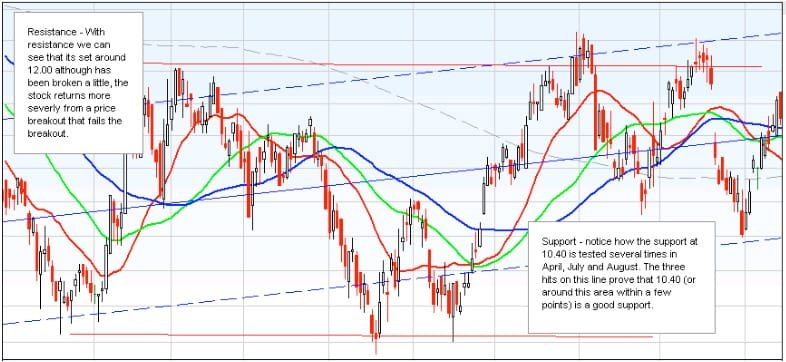
Support is where the price stops falling consistently. Look at the chart below.
You can see where I have drawn the Support line. This is where buyers believe that the share is good value and start buying back into again. What usually happens, should the price fall again, is that the previous price point acts as a psychological support, it was good value then, so it probably is still, so they buy in again at the previous level.
This tends to continue until an event, news, dividend etc. causes the price to fall or rise and a new support level is built up again. As a rule, the more times the support line is hit, the stronger the support, but also the stronger the probability of a price change either up or down when nearing this support. You will have to use your other tools that you already know about to decide whether this is the case.
Resistance
Resistance is the opposite of support. This is when people stop buying, they believe that the share is overvalued.
Looking once again at the below chart, you can see where I have drawn in the Resistance lines. The same psychological reasons apply. If there is a previous resistance peak, then chances are that the price will not rise past it much at all.
However, like with support, the more times the resistance is reached there is a stronger likelihood of a new support and resistance being formed.
*Breakout: Is when there is a sudden price change up or down.
Triangles
Which moves us nicely to the other pattern I tend to look out for and that’s Triangles.
A triangle is when the support and resistance gradually becomes smaller, creating a concentric pattern, which, with a bit of imagination can be seen as a triangle on its side.
A triangle is much like a mini pressure cooker. As the triangle tapers down, the distance between the support and resistance become smaller, creating instability in the share’s value – which leads to a breakout*.
From my experience I have noted that a triangle can only be classed as such once it has passed three consecutive tightening support and resistance levels. Generally, the breakout will follow that of the prevailing trend.
Head and Shoulders
No I haven’t gone mad, although these modules have driven me close at times. Head & Shoulders is a popular thing you will hear Technical Analysts shout and get excited about. Hmmmmm! I still have trouble not thinking of shampoo when I hear this term, but that’s an aside.
Head and Shoulders: What is it?
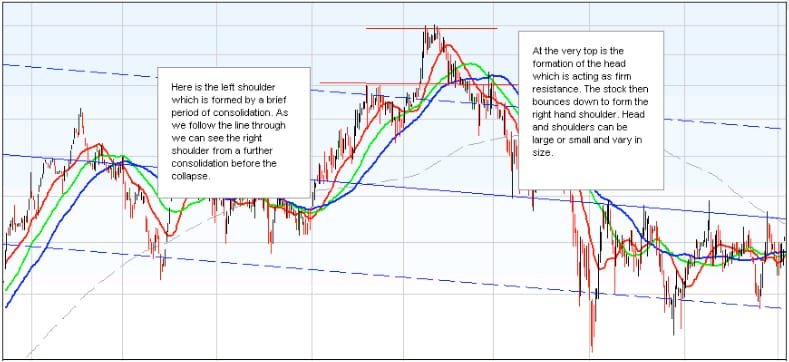
Head & Shoulders is when a chart’s support and resistance peaks once (1 shoulder) then peaks again but much higher (Head) and then tries to peak again but doesn’t make it and creates a peak lower than the head (second shoulder).
Now the theory does make sense and sometimes head and shoulders do come into play and work. There are problems with them though, in that you can pretty much look at any chart and spot hundreds of the buggers, or in fact look at a larger time spread of a chart and see a huge one covering years.
I like to see head & Shoulders as much like beauty, it is in the eye of the beholder. In other words, people will want to see what they want to see, and once they do that they become transfixed to it.
You can even get a REVERSE head and shoulders. Just to add even greater confusion.
Much like some of the others. I will draw them in onto a chart. Mainly to see if the Technical Analysis old school view is right or wrong.
From my experience though, Head and Shoulders is the least important indicator that I take notice of. They are not strict patterns, in fact some of the Head and Shoulders that have been pointed out in some books I’ve read, would make an odd shaped torso. Back to the beauty in the eye of the beholder again. From experience the breakout, if there is any, tends to follow the prevailing trend.
So there you have it. All the tools that I use to spot price movements with which we will make money from using in Financial Spread Betting . You can of course use these tools and techniques to spot shares to buy, rather than bet on using Financial Spread Betting. Obviously this time you would be looking for ones that are only going up, unless you were mad!
Using all the tools together is simple. If you feel confused as to how they are applied, then I suggest that you first reread the modules from the second part onwards. Double check that you understand how you configure the tools that we use, as if these are set incorrectly they will lead to incorrect readings and possible loss of money.
The Bounce/Retrace
I have mentioned this at various stages throughout these modules. A bounce is a method that I use and have developed using Japanese candles that we have previously discussed, scalping – where we look to make quick gains from swings within a larger trend, and applying the Fibonacci tool to add a profit target to that bounce.
I realise that it does sound relatively complex, but please watch the corresponding video in the student website and you will quickly understand it all.
Quite simply, we look for a chart that is reaching a point of either extreme overbought/oversold positive (long or short), that is close to resistance or support, with a reversal candle. We then look for a sign of recovery, either a further candle or a slight upturn in the Momentum – or you can live life a little dangerously and trade before the second signal, as the bounce is incredibly powerful.
Once we have the criteria set and we have found our Long or Short candidate, we use the Fibonacci tool to gauge potential profitability of that trade. Remember if the stock is a retracement bounce, the stock may retrace up to 50% and certainly up to any point where there has been consolidation. For a Long bounce from support, we can expect gains up to 38.2% of the prior short trend.
The life span for this type of trade, which is sometimes called scalping – but the techniques used for scalping markets are numerous and some are rather dubious in nature, is very short, usually a day sometimes 2 or 3, but certainly not much longer than a week before that current bounce turns again.
The best candidates for this style of trading are highly volatile stocks in the US, found in the S&P100, DJIA and the NASDAQ. Be careful of course, but there is real potential for excellent scalping opportunities.