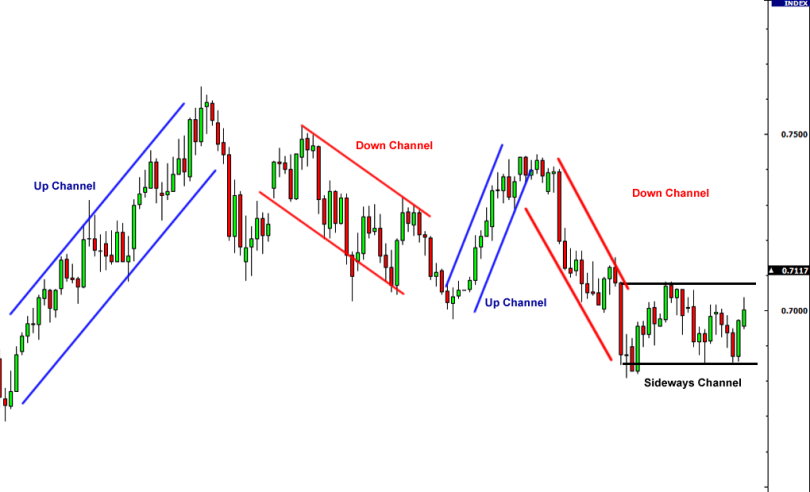
Drawing two lines upon a chart across past highs and lows can help you decide your next trade. This is another idea that develops out of the trendline concept and is referred to as the channel line, sometimes called the return line. Sometimes you’ll notice that prices keep between two parallel lines, the trendline and another line on the other side of the price action, which is called the channel line. You’re most likely to see this in a stable uptrend or downtrend. All you have to do is draw your trend line, then draw a second line parallel to it, from the first high point (for an uptrend) or low point for a downtrend. Here’s how it looks on an uptrend –
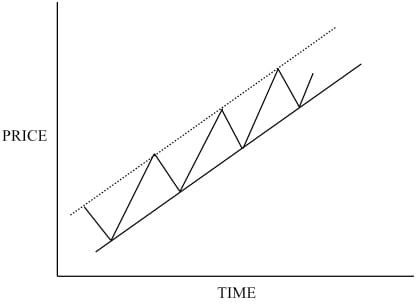
The dotted line above the price is the channel line, and the price action happens between the two lines, fluctuating up and down. Whenever the price reaches up to the channel line, it acts as resistance and bounces the price back down to the trendline, or support.
For a downtrend the channel looks like this –

Again, you draw the trend line first, this time joining the peaks, and then the channel line is drawn parallel to it.
Channel trading is simply an extension of trading with the trend and it is easy to see how this extra line can help you with your trading. Markets are prone to swinging in similar up and down ranges so using channels can help calculate how far away a market could offshoot from a trend. This is particularly useful in spread betting since most traders are looking to run positions for a few days or longer to take advantage of a trend.
In a nutshell, channel trading consists of drawing an upper and lower band, beyond which the probabilities of the stock price moving are statistically less likely than the present situation. In an uptrend, if you initiate a long position at the trendline, you will know to take your profit when the price reaches the channel line. You will not need to watch the price for a reversal as closely, as you have a good idea where it is going to happen; and you can also use the channel line to estimate the amount of profit you will get from the trade. Some traders might even take a short position in an uptrend when the price is at the channel line, although this is more risky as it is trading against the trend.
The channel line is similar to the trendline in several ways. Once a trading channel has been established, the probabilities of it continuing are increased as traders look for confirmation. It is considered more valid the greater number of times it has been touched and not violated, and the longer it has been in existence. This helps to measure the strength of the channel. Also, breaking the channel line is significant, although in this case it indicates an acceleration in the existing trend, rather than a pending reversal. In fact, if the line is broken in an uptrend this can be taken as a reason to add to a long position.
Trading channels can also last for long periods of time. For instance one trading channel was established in the FTSE 100 throughout 2011, until the break out to the downside in August and this provided spread traders with plenty of opportunities to sell the highs and buy the lows, as the index kept trading within the 5,800 and 6,100 trading ranges. This FTSE channel trend broke out last August (2011) and this led to a sharp move in the direction of the break out – and this would have signalled a good entry point.
The channel line is also important in indicating the strength of the trend. If the stock has been rising in an uptrend, going between the trendline and the channel line, and the next time it rises it does not get as high as the channel line, but peaks and reverses, this may be an early indication of a weakening in the trend. In this case you would watch the price drop to the trendline to see if that was going to be broken.
If a channel line is broken or not reached, some traders will take this as a definite indication that the trend is changing, either strengthening or failing, and use the new peak to draw a channel line at a new angle. From this, they will redraw the trend line parallel to the new channel line, starting at the last touched point. The reasons are simple. If the channel line has been broken and the trend is accelerating, then the trendline will become steeper, and drawing it sooner gives you better information for trading. On the other hand, if the trend is failing, as evidenced by the failure of the price to reach channel line, then the trend line will need to be adjusted downwards to more accurately reflect the new situation and market sentiment.
As I mentioned in the trendline section, you can get price targets for a breakout from considering how far the price went from the line. The channel line makes this process much more obvious. Any time the price breaks out of a channel you can expect it to go as far as the channel width away from the broken line. Channel lines can’t be drawn all the time, and in a later module we’ll see some patterns where the lines above and below the prices are clearly not parallel – but when they can be drawn they can provide valuable solid information that is invaluable for spread traders to decide on a market direction.