
As you can tell by the name, the Commodity Channel Index (CCI) was originally developed with commodities in mind. It’s also used for futures and options. Here it is on the share chart we’ve been looking at –
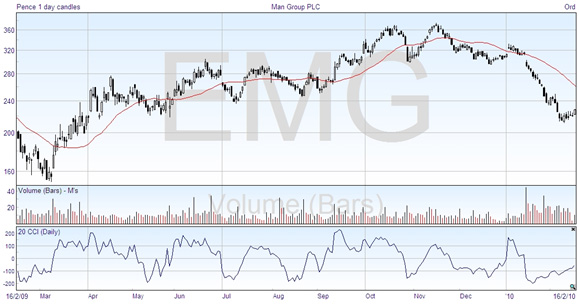
The creator of this oscillator, Lambert, decided to compare the current price with the moving average over a period of X days. X is often 20 days, and is settable. The chart above shows a 20 CCI. This gives a smoothed basis in comparison with the momentum indicator or ROC. Lambert went further still by ‘normalizing’ the number by dividing by the mean deviation. The result of this is that the values usually vary between -100 and +100, and when they go beyond these boundaries they count as overbought and oversold.
The original idea that Lambert had was to buy on moves above +100 and sell short on a drop below -100. Having said that, many technical analysts simply use the CCI to tell when the underlying security is overbought or oversold, that is outside the ± 100 range. As with all oscillators, you can take note when the CCI is going in the opposite direction to the price, and particularly when the indicator comes back within the range.