
The rectangle pattern goes by several other names, and is distinctive enough to spot easily on a price chart. You may recognize it as what Dow called a line, and it is also referred to as “trading in a range” or as a “congestion area”.
It is simply a consolidation period in a trend, which can be up or down, and usually ends with a continuation in the original trend direction. It looks like this in an uptrend –
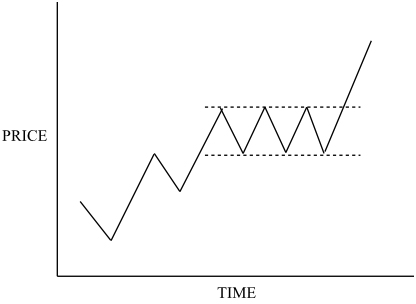
If you have read Nicolas Darvas’ book ‘How I Made $2,000,000 in the Stock Market’, a classic published in 1960, you may recognize that he called this box trading and used this pattern, repeated successively, trading the breakouts as the stock moved from level to level. Darvas was often away from home pursuing his dancing career, but the simplicity of his plan using directions to his stockbroker regarding the rectangular formation meant that his account was growing even in his absence.
You can compare the effect and meaning of the rectangle formation to that of the symmetrical triangle. It is plainly a balanced pattern, with no inbuilt bias to uptrend or downtrend, so as with the symmetrical triangle it represents a pausing place for consolidation. The major difference is that with no approaching apex there is no pressing time limitation for it to be resolved in a breakout. You will normally see a pattern length of one to three months. When a decisive breakout happens, with at least a close outside the bounds of the rectangle, that completes the pattern, and confirms the future direction.
Although it will normally constitute a continuation pattern, you should keep an eye on the volume of trading for some assurance of this – the “with trend” moves should have a heavier volume than those that go against the trend. As you may have noticed, the pattern resembles the triple top reversal pattern, and the difference, until made clear by the breakout, is that the volume indications go the opposite way. If the with trend volumes were reducing, and the others increasing, then you would more reasonably expect this pattern to resolve as a triple top reversal.
The usual recommended method of trading, particularly when you are starting out, is to trade with an established trend, riding on the back of it for as long as it keeps going. This method is clear-cut and high probability, and you are simply defining in your trading plan how you will identify a trend, and when you will enter and exit the trade with the trend.
However, when you come across this clear rectangle formation pattern you could take short term positions within the range. You would buy at the lower line and/or sell short at the top. The risks are not great, as you will know straight away if the price breaks out of the pattern, and be able to exit the position and take up an opposing trade. Because the pattern is so clearly defined, there is little opportunity for mistakes. While the pattern will resolve as the market wishes, and not necessarily in the direction you expect, you can have tight control of your stop loss positions to minimize your risk.
The alternative way to trade the rectangle is to assume, on the basis of probabilities, that it will be a continuation pattern, and take a long position near the lower line, waiting for the breakout for your profits. To feel comfortable with this tactic, you should check in advance that the volumes indicate the continuation rather than the triple top option. An intermediate way of trading on this pattern would be to trade only in the direction of the trend, exiting your trade each time the price reversed on the opposite line, and waiting for the price to retrace before entering the market again.
It is easy to see price targets for the resolution of this formation – as the lines are parallel, the distance between them is the amount you can expect the breakout to move once the price breaks out of the box. With such clear boundaries, the lines work as support and resistance with a reversal in role when violated, as covered previously. For example, in an uptrend, after the breakout the upper line will change from being a resistance to become a solid support line for the higher range.