
Yet another way to draw lines on a chart which may prove to be useful, speedlines is a technique developed by Gould. It uses one-third and two-thirds as ratios again, but in this case the fractions are not applied to the retracement, but to the speed of the trend, that is how fast the price is going up or down, as measured by angles on the chart.
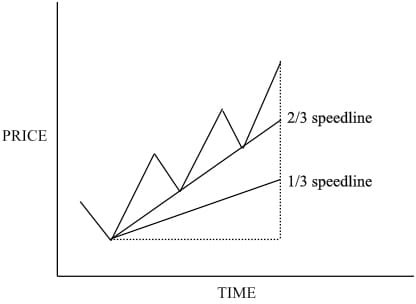
For an uptrend, you would draw a bullish speedline as follows. From the highest point in the current trend draw a line down vertically to the price where the trend started. Divide that line into thirds, and draw a line from each third to the start of the trend. See below.
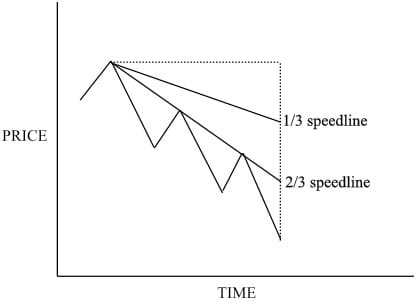
You should do this each time there is a new high formed in an uptrend, or a new low in a downtrend. Here’s the speed line example for a downtrend –
Because of the way they are drawn, sometimes these speed lines cross through the price action, and don’t just touch the highs or lows. But the idea is that the lines may act as support in an uptrend, or resistance in a downtrend, during market corrections. If the price crosses a speedline, then the line may reverse role and become a resistance or support.
In an uptrend, usually the retracement will stop at the higher speedline, the two-thirds speedline. If it passes through that, it should stop at the lower speedline otherwise the trend would seem to have failed. Similarly for the speedlines in a downtrend.
Now, as mentioned in the last section, there are some theories which attach weight to 38% and 62%. So understandably you can also draw speedlines at these percentages, and they are called Fibonacci fan lines. And, not to be left out, W.D. Gann attached significance to eighths, so you can even have ‘Gann angles’ to split the arc up even more – these give you a choice of eight or nine lines that ‘may’ act as support or resistance. You can exploit Fibonacci fan lines, but not knowing in advance which line of many to choose it is more difficult to see the use of the Gann angles. However, you will find them on most good charting programs, so you can experiment. These lines are used just as speedlines, trendlines, etc. They may provide support/resistance, and if one is broken the price may fall/rise to the next line.