Strength of the Line
Just as with support and resistance, there are various ways that you can gauge how “strong” the line is, or in other words how likely it is to hold up in the future. Once again, as with support and resistance, if you can trust the line most of the time you can base your trading off it and stand a better chance of making a profit. In the same way as with the other lines, you can consider the trendline more or less significant depending how well it has stood up over time. The longer it has been acting as a support or resistance level for the current trend, the more it can be relied upon.
Carrying on with the analogy, another gauge of the strength of the trend line is how many times it has been tested, that is touched, and withstood against penetration, just as with the support and resistance. You can also look at the volume of trading at the times when the price has touched the trend line. If the trend line is well-established, then the more it can be trusted to hold up, and the more significant event it is if and when it is broken. The only dissimilarity to support and resistance is that whole numbers have no part to play with a continuously sloping line.
Getting All the Action
By the way, the standard way to draw trendlines is to include all the trading action, whether the low point for the day or weekly candlestick is transitory or not—you may find some analysts drawing the trendline using only closing prices, arguing that these are the most important prices for the day, but it’s more common to take into account all the trading activity. Sometimes it makes a difference, although you shouldn’t worry about the odd pence or cents either way.
Using the Trendline
Once you have a verified trendline drawn it can be very useful. As noted in the Dow Theory, trends tend to continue until something major happens to stop them, which means that you should generally expect the price action to continue in the same uptrend, using the trendline as a support. In fact, once the uptrend has established itself as a certain rate of increase, or slope, you usually expect it to maintain the same angle. If it changes slope, then this gives an early indication that the trend is changing, whether up or down.
The most basic use of the trend line is to see where you can buy in an uptrend, as you can expect the price to come down and touch the line during corrections or retracements, before going back up again. The line effectively provides a moving support for the price, and you can use this to improve your trading.
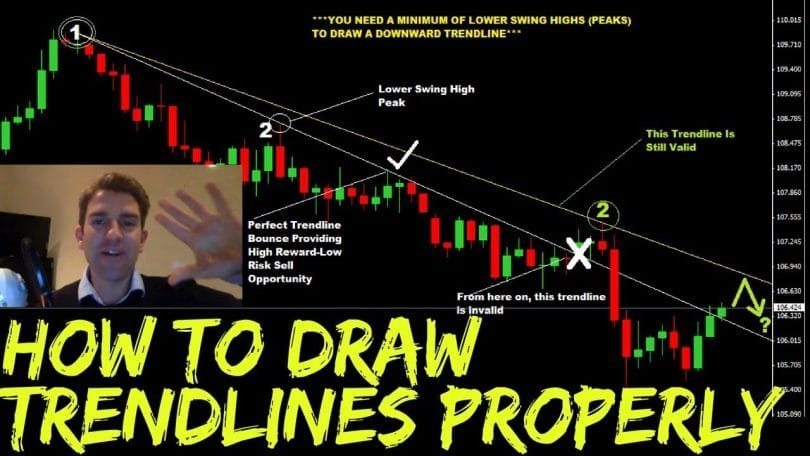
In a downtrend, the opposite applies, the trendline is a resistance. The price will keep coming up to touch the trend line and you may choose to go short when the price goes up to touch it on a retracement. Once again it is a moving target that changes over time in line with the current trend, and you’ll quickly see signs of any change in the trend.
In this way, the trend line can be more useful than even the support and resistance lines. It gives us a moving target to determine the extremity of price action that we should see, so it is possible to follow along with the trend and take maximum advantage of the price fluctuations.