When we discussed market action in the first module, price was only one of the factors. The second factor in most trading is the volume, and it is important for technical analysis that we have a way of examining that. If you remember, Dow was interested in volume as a confirmation that an apparent trend was valid. It makes sense that if hardly anyone is buying, the price might be distorted, but if there is a lot of buying and selling going on, it indicates that the price is soundly established. Another way of putting it is that volume is a confirming indicator of a price move.
Volume is the total amount of trading that has gone on during the day, whether it is the number of stocks that were bought and sold, or the number of futures contracts traded. It is usually shown on a chart by a line of vertical bars, shown separately at the bottom.
It seems obvious when you think about it that a lot of buying and selling action is more inclined to produce a “real” or solid price. If there are many buyers and sellers, these in effect represent votes for the price at which they are trading with each other, so you are getting many more people agreeing to the level that the security is priced at.
Defining Volume and Open Interest
It won’t happen in most trading situations that you get involved with, but you should just note that in some cases just one or two purchasers can make a big difference to the price by investing in or selling a great number of shares. This might happen, perhaps, if a money fund decided to make the trade. The volume would show up in exactly the same way, as the chart is simply based on the number of shares or other securities transacted.
Usually you will not need to consider this. It occurs more in the case of what are called “illiquid” markets, where there are not many market participants, such as is the case with some small cap companies. In general spread betting providers deal in the more liquid markets. And for many money funds, the fund rules or government regulations require that the fund only invest in companies over a certain size, precisely to avoid the possibility of such quirks in the market.
Here’s the last chart with the volume added.
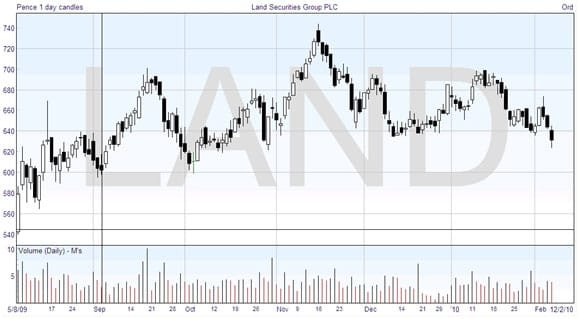
Each vertical volume bar lines up with the candlestick for one day, and shows the trading for the day. The height of the volume bar shows the amount of volume on that trading day. The scale on the left goes up to 10 (millions), and the highest bar is on 18th September, which almost reached that number. The area of lowest volume, apart from one day, appears in December and if you look at the price you can see that there was not much direction to it, indicative of a weakness in interest among buyers and sellers. This chart is plotted with black bars when the volume has increased since the previous day, and red bars when it has gone down, and you can set options like this in the software.
Volume and Open Interest
You may find that volume leads the price. If the volume goes up it shows increased interest. If the price is in a downtrend, then increased volume or spike may indicate that many current holders of the stock are giving up and selling up. This could indicate a good time to buy, perversely, as any time there is a rush in the markets it may tend to go too far, and have to bounce back again. An example of this is the spike at the end of October in the chart above. The price was falling, the volume went up then the trend reversed. You can see the opposite effect in the middle of September, when an uptrend had greater and greater volume, followed by a switch to a downtrend.
There are other ways in which the variation in volume can be brought into the chart, and used to confirm or deny initial indications of the direction of the price. We will get to those later.