
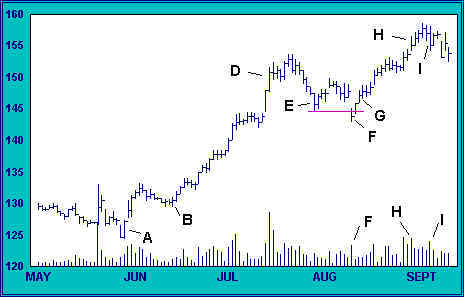
After a correction to E, the index rallies weakly before gapping to a correction low at F. By now the index has marked time for two weeks, and new support has been building between 145 and 150. Further, the distribution between 150 and 153 is not yet large enough to threaten the strong upward trend. Finally, as we noted in the last lesson, declining volume on the correction indicates that sellers are not aggressive. For these reasons, we conclude that the technical condition of the index has been improved by the correction.
Given this conclusion, we suspect that the break of support at F is a shakeout.If so, the implications are bullish.This suspicion is reinforced by an increase in volume which attends compression of the high-low spread on the session. We conclude that savvy traders are holding the bag for shares offered by frantic sellers. Nevertheless, we wait for confirmation before taking a position.The next day, the index rallies and closes at the high.We add again to our long position at the opening of the next trading session (G).

The rally out of the shakeout (F) carries to the old high around 153, where trading narrows on declining volume. It appears that residual supply is being successfully absorbed at the old high, so we hold tight.
The index rallies to a new high. The session at H, however, reveals that sellers are active. The opening upside gap was no doubt the result of an early-session buying surge following the rally to new highs. But the intra-day reversal on high volume is evidence that strong hands are once again taking advantage of buying pressure to unload positions.
Volume often peaks before price. When price accelerates after trending upward–as the index did from 142 to 152–buyers are at their most optimistic and rush headlong to get in. Strong hands are able to sell on a large scale. Once price corrects, however, buyers become wary.Often a new high or an infusion of positive news is needed to re-ignite buying interest. The rally to a new high at H triggers another burst of buying, but the volume there does not match the earlier volume at D. Buying enthusiasm has already peaked.
By now, price is very close to our most ambitious objective of 158. However, we are careful not to rely too heavily on point & figure analysis alone. A stock or index may not reach calculated targets, or may exceed targets. Point & figure charts should be used only to identify price zones worthy of closer study. Our best guide to the internal dynamic of the tape is the price-volume chart. Study of these charts reveals important shifts of power in the struggle between buyers and sellers.
In the present case, our analysis of price and volume confirms that the index may be topping, and we resolve to exit our long position on the first clear sign of weakness.
Selling turns aggressive at I, as evidenced by an increase in both volume and spread on the decline. We conclude that, having already shed the bulk of their positions, strong hands are offering the remainder at the market. The urgency of their selling tips us off that those now in control sense that time is quickly running out on the rally.We follow suit and liquidate our entire position on the opening of the session following I.
Distribution and markup, as noted earlier, have similar volume characteristics. During both markup and distribution, volume tends to increase as price advances.For that reason, distribution may be considered the final stage of the marking up process.
However, there are important differences which separate markup proper from distribution. During the bullish phase of markup, volume increases come early in a rally and provide lift off the bottom (note the increase in volume at A). During distribution, however, the increase in volume usually comes after a rally has been underway and acts to slow or stop the advance (D).
The price-volume character of liquidation is technically quite different from that of mark up or distribution. During liquidation, volume tends to increase as price declines. Therefore, the price-volume action at I should be heeded as a possible harbinger of change, from mark up to liquidation.
This early indication of liquidation adds to the evidence of technical erosion which has been gathering since the middle of July. We have good reason to expect further weakness.