In the last lesson, we learned to compute the periodic relative strength of stocks in a target universe. In this lesson, we will outline the remaining steps required to compute the Spread.
A diverse universe of stocks is sorted by relative strength into two sets, a) those which are stronger than or equal to the benchmark and b) those which are weaker than the benchmark. However, just knowing which stocks are currently stronger and which are weaker than the average stock (benchmark) by itself provides no information about the probable future performance of these two sets.
Strength-following traders take it as given that strong stocks will always perform better, while contrarians assume that weak stocks, because they are relative bargains, will perform better. We make neither assumption, but choose rather to inspect the forward performance of relative strength leaders and laggards to determine which group is in fact doing better. At times the trend of capital flow will favor strong stocks, while at other times, weak, or laggard, stocks.
Driving our method is this question: What is the predictive value of relative strength? Are strong stocks or weak stocks more likely to perform better in the future? Over, say, the next week?
To find out, we wait five trading days to see which set of stocks, those which are now stronger than the benchmark or those which are now weaker, perform better going forward.
Say we find that the average performance of strong stocks turns out to be superior to the average performance of weak stocks over that next week.Chalk one up for the strong stocks. But we are looking for a trend, and one week is hardly a trend.
To see a trend we repeat the process over time. Here’s how to make those calculations:
1. Compute the 100-day relative strength of each stock in the universe using the method developed in the last lesson. This computation gives the periodic RS of each stock as of day 100.
2. Group stocks into RS leaders (RS > or =1.00) and RS laggards (RS < 1.00).
3. Average the percentage daily changes of the stocks in each group over the next five trading days, days 101 to 105.
Caution: The data set used to compute RS must be separate from the data used to compute forward performance. There are a couple of reasons for this. First, if we do not look ahead, then our results will have no predictive value. Second, if data used to compute RS are erroneously also used to compute forward performance, the results will not be predictive but self-fulfilling. You have made this mistake if the Spread always rises.
4. Repeat steps 1 – 3 for subsequent periods. For example, group stocks by relative strength as of day 101, then compute the average forward performance for each group for days 102 through 106, and so on.You should generate two sets of daily performance figures, one for relative strength leaders and one for RS laggards.If you have repeated steps 1 through 3 over, say, a three-month period, then the next step will generate a three-month history of the Spread.
5. Starting with a value of 0, cumulate daily forward performance figures for the group of relative strength leaders. This is accomplished by adding each day’s figure to the previous sum.Repeat this process for RS laggards.Two series result from these calculations.One, shown in blue in the chart below, is the cumulative forward performance (CFP) of relative strength leaders. The other, in red, is the CFP of RS laggards.
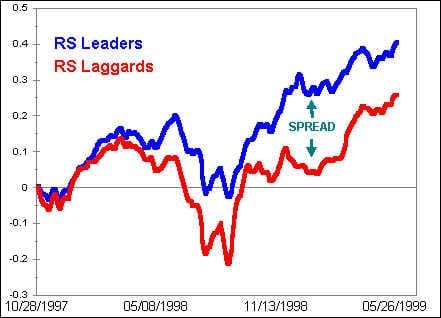
Daily-basis calculations from October 1997 to July 1999
The difference in cumulative forward performance between RS leaders and RS laggards is the Spread.
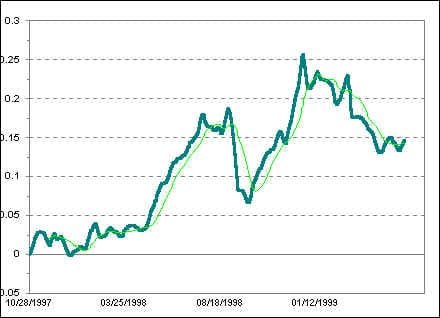
6. To compute the Spread, subtract the CFP of RS laggards from the CFP of RS leaders. The Spread (below) is the arithmetic difference between the CFPs of leading and lagging groups.