
The chart below shows the results of strength-following and contrarian strategies over a period of twelve years, from early 1987 to mid-1999. The target universe is composed of a diversified list of group indexes.
The protocol used is simple. The relative strength of each group index is calculated using price data from the previous twenty-week period.Groups are then sorted by relative strength. Those with an RS > or = 1.00 are assigned to a strength-following portfolio, and those with an RS < 1.00 are assigned to a contrarian portfolio.Performance over the following week is recorded for each portfolio.Weekly results for each portfolio as well as for the benchmark (average group) are cumulated over the twelve-year test period.
Strength-Following vs Contrarian Strategies
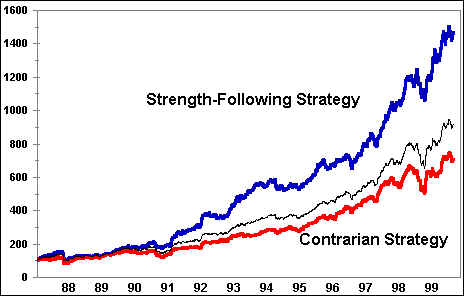
Over the whole twelve-year period, strength-following proved to be the more productive strategy, beating both the benchmark as well as a contrarian strategy. This is due to several factors. First, the Spread rose for seven of the twelve years cumulatively, generating more favorable results for strength-followers about 58% of the time. Second, when the Spread rose, prices also rose nearly 70% of the time. In contrast, a falling Spread gave contrarians the advantage for only five years out of twelve, and then prices rose only 50% of the time.
Even though a strength-following strategy outpaced a contrarian strategy over the full period, traders nevertheless favored laggards over leaders better than 40% of the time.
In the chart below, periods during which a contrarian approach yielded better results than strength-following are shown in yellow.
Contrarian vs Strength-Following Periods
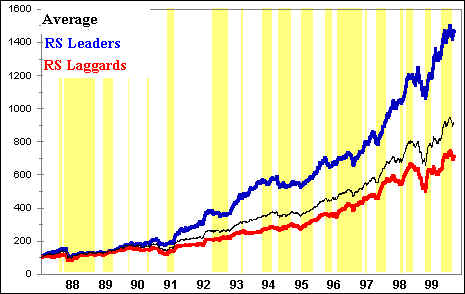
Periods favoring a contrarian strategy are shown in yellow. White areas mark periods during which strength-following yielded better performance.
The Janus Strategy
While a strategy of staying with relative-strength leaders has outperformed the average, shifting strategies in accord with the direction of the Spread, from strength-following to contrarian bargain-hunting and back again, has yielded even better results.
The Janus Strategy takes advantage of the two-sided nature of the market, holding only relatively strong groups as the Spread rises, then switching to RS laggards as the Spread falls.
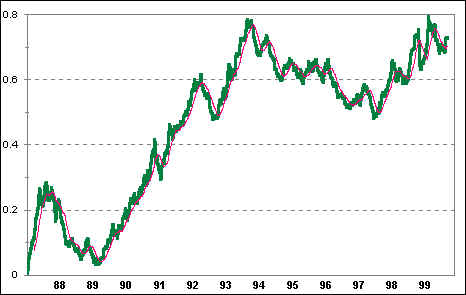
In the following example, a simple ten-week moving average of the Spread is used to trigger the switch back and forth between contrarian and strength-following strategies. When the Spread is above the moving average, RS leaders are selected; when the Spread is below the moving average, RS laggards are selected. The next chart shows the twelve-year Spread against its ten-week moving average.
The Spread vs Ten-Week Moving Average
The next chart shows the cumulative results of strategic switching from RS leaders to RS laggards in accord with the direction of the Spread:
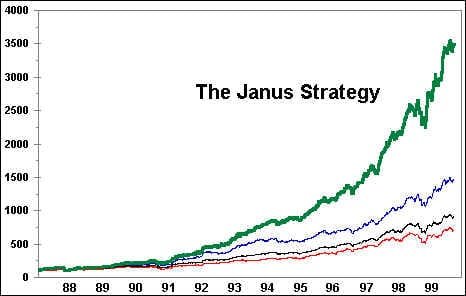
The fact that a crude switching mechanism can lead to such an improvement in performance is evidence that the Janus Strategy is robust.
Caution: The methods discussed in this chapter should not be used mechanically to make trading decisions. A ten-week moving average was employed for purposes of back-testing only. In a test of this sort, it is best to adopt some simple, fixed switching device in order to escape the criticism of having rigged results with perfect hindsight. The point of these demonstrations is only to impress on the student the strategic importance of the market forces captured by the Spread.