Computing Relative Strength
Here’s a mental experiment in relativity:
Imagine that you are standing on the bank of a river watching a motorboat race. How would you determine the speed generated by the boats themselves, without the influence of the river’s current? (If the boats are racing against the current, they will appear to be moving more slowly than would be the case if they were moving with the current.)
One way might be to move the boats to a lake and clock speeds. With no current to affect the results, the true speed of the boats can be determined.
But there is another method: first calculate the speed of the current, then add or subtract that figure from the apparent speed of the boats, depending on whether their course is upstream or downstream.
Similar relativity is at work in the markets. The overall market affects the performance of individual stocks (and groups) in the way that the river’s current influences the apparent speed of boats in the example. Using a calculation similar to the one above, the true performance of an individual stock may be determined by subtracting the market’s performance from the performance of the target issue. What I have here termed “true performance” is more commonly referred to as “relative strength”.
There are several methods used to calculate the relative strength of stocks and groups. Some are flawed, but one is free of most drawbacks, and it is the one we shall use.
To calculate the relative strength of an individual issue or group, first choose an appropriate measure of the broad market–a benchmark. Webster’s Dictionary defines “benchmark” as “a standard or point of reference in measuring or judging quality, value, etc.”
One may use a market index such as the Dow Jones 30, the Standard and Poors’ 500, or some other market measure. An appropriate benchmark is one that reflects the interests of the analyst.If, for example, the stock is a small-cap issue, then using a small-cap index might be the most appropriate benchmark.It’s up to you to determine what is relevant.
For most purposes, however, one of the major market indexes will serve. The stock selected for study in this chapter is Wal Mart (WMT), a large-cap issue, and the benchmark we will use is the SP-500 Index, a large-cap index.
Next, choose the historical point from which relative strength measurements are started. Any point may be selected, but it is most useful to pick an important high or low point in the benchmark. In our example, the SP-500 Index low registered on October 11, 1990 is the beginning point of our calculations.
Once the benchmark and starting point have been selected, a little arithmetic is all that’s needed. Here are the steps:
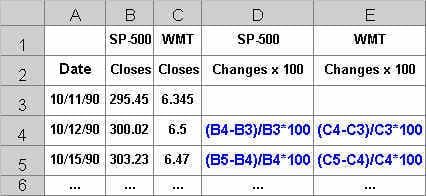
1. Separately, for both the benchmark and the target issue, calculate the percentage change for each day. The formula is:
today’s close-yesterday’s close)/yesterday’s close * 100.
If you are using a spreadsheet to make your calculations, your spreadsheet formulas will look like this:
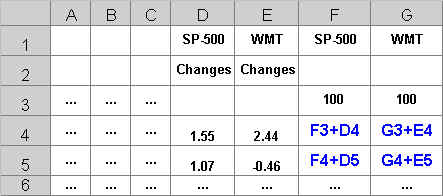
2. Substitute a value of 100 for the beginning values (values on 10/11/90) of both the benchmark and the target. Next, add each day’s change cumulatively to the beginning values (columns F and G):
3. Finally, calculate Wal Mart’s relative strength (RS) by dividing the cumulative value of WMT by the cumulative value of the benchmark. Then multiply the result by 100 (column H):
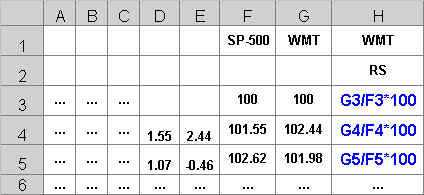
These calculations yield the relative strength of the target:
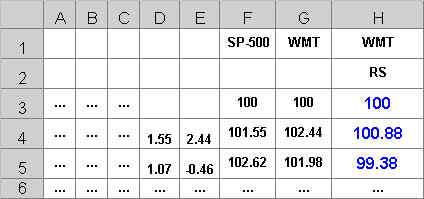
The beginning values of the benchmark, the target issue and the RS calculation are now all set at 100. For that reason it is easier to make graphic comparisons, as we shall see in the next lesson.