Module 9 – Elliott Waves and Cycles of Time Introduction Elliott Wave Theory has been around for decades. Ralph Nelson Elliott first used it in the 1930s, but it wasn’t until the 1970s that it was popularized in the book...

Module 9 – Elliott Waves and Cycles of Time Introduction Elliott Wave Theory has been around for decades. Ralph Nelson Elliott first used it in the 1930s, but it wasn’t until the 1970s that it was popularized in the book...
Summary Oscillators show an extreme condition in the market – the price has gone too far, too fast. Oscillators can show when a trend is losing momentum. All oscillators have the same basic characteristics. An oscillator is a...
It must be said that the root of all trading is being aware of the market sentiment, which guides the future direction of prices. Regardless of where you think prices “should” go based on any available research, they...
Think about it. The vast majority of beginning traders (80% to 90%) fail to succeed in the first six months and give up. Of course, they don’t all take the time and the care that you are in learning to trade, so failure is...
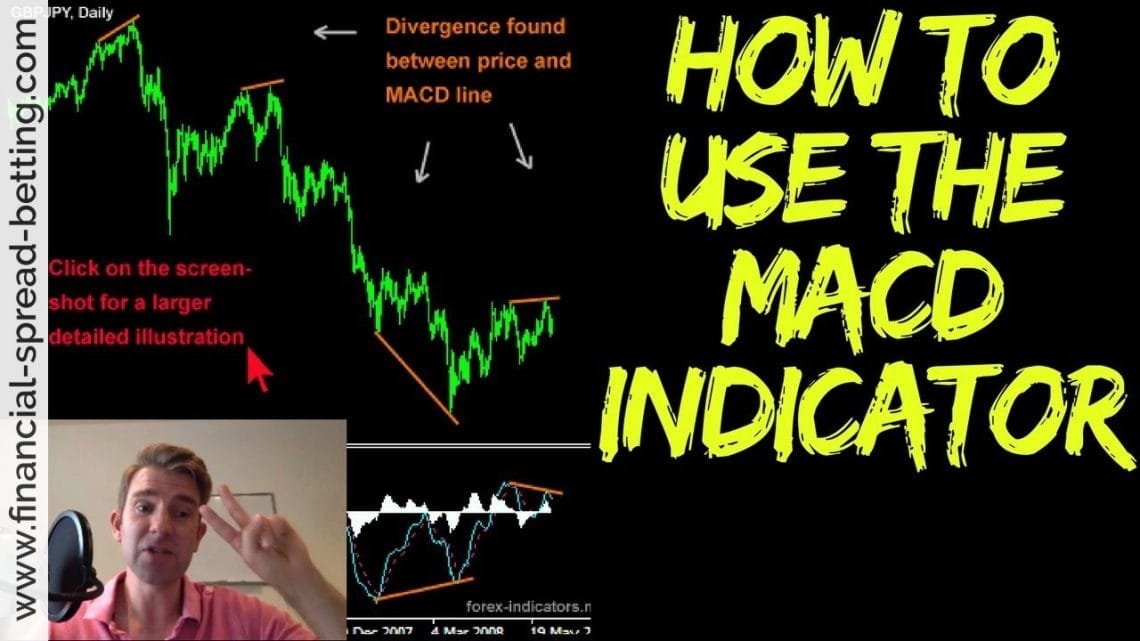
I mentioned in the last module the oscillator that is made up of two exponential moving averages, and it goes under the splendid name of Moving Average Convergence/Divergence Indicator. This is usually shortened to MACD, and it...

Just as with the moving averages, you are free to change the number of time periods that any of these oscillators and indicators use, and you will find different results. With moving averages, you use the smoothing of the values...
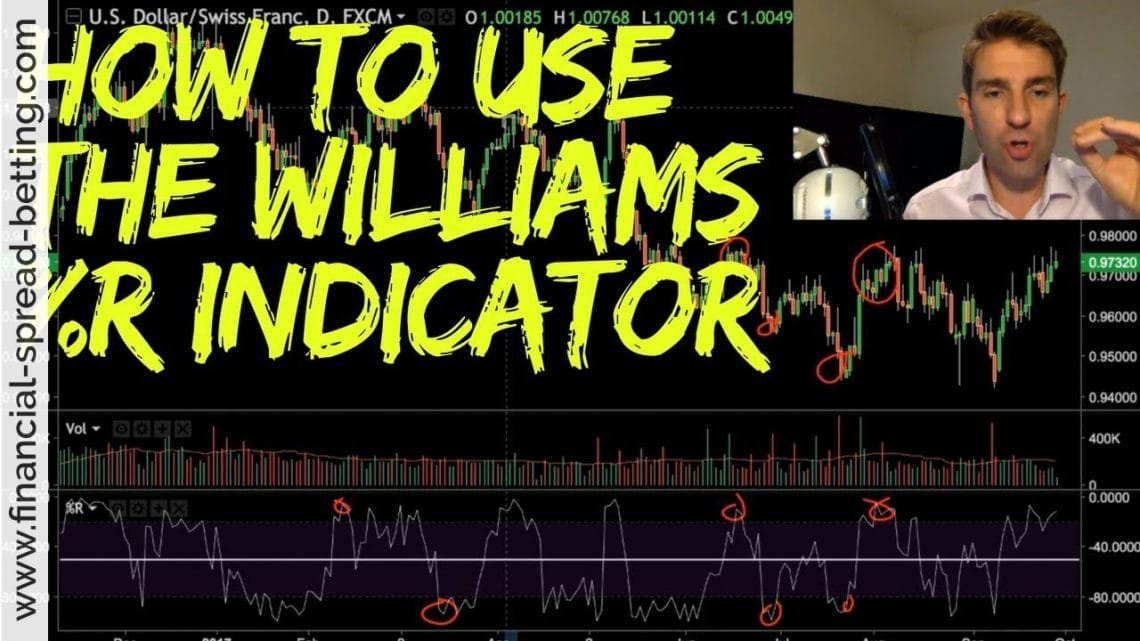
The Williams oscillator is based on a similar idea, taking account of the position of the price close in relation to the price range over a certain number of days. It is shown below for 20 days. In practice the close is...
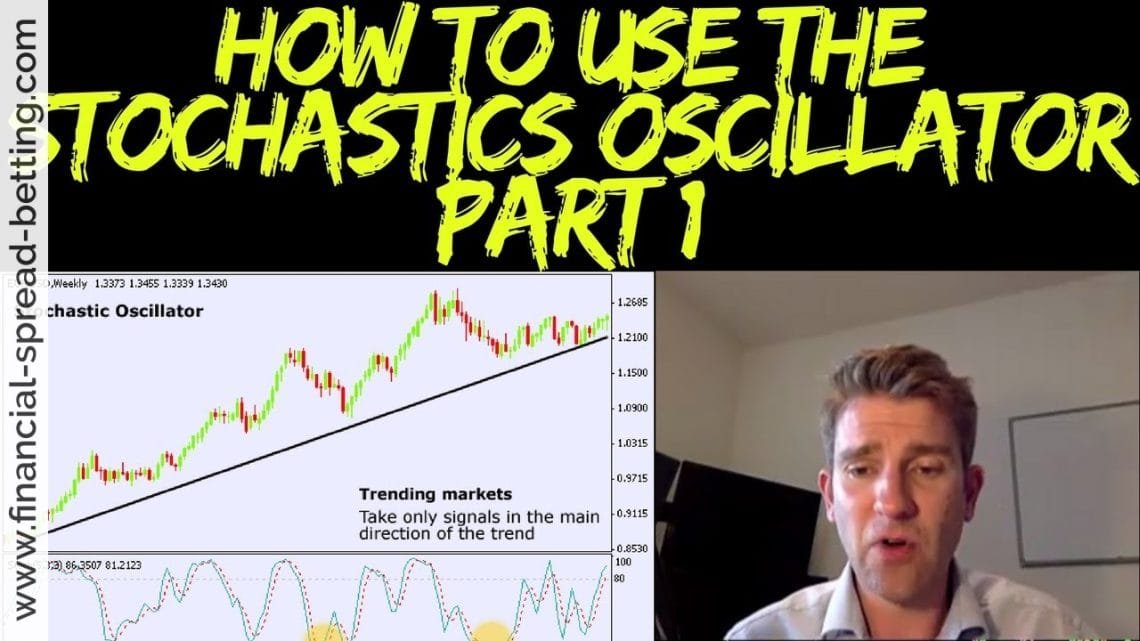
The Stochastic Oscillator was invented by Dr. George Lane, and for a period in the 1990s it became a Holy Grail for traders. It goes into more depth on the price action than many other oscillators, which may explain its...
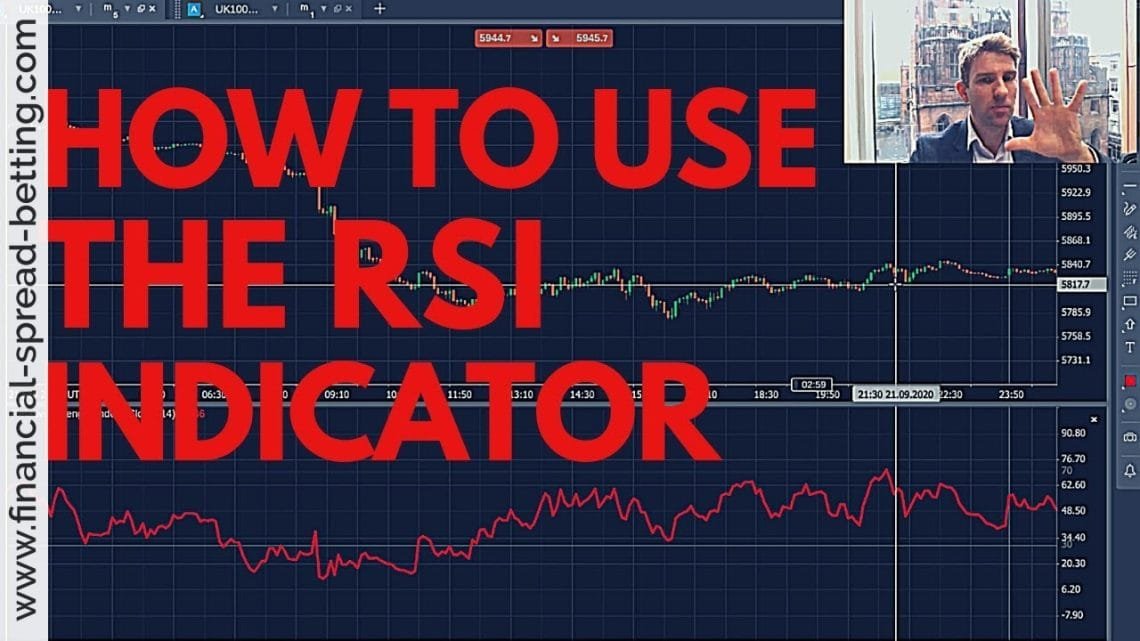
The relative strength index is a very popular indicator, invented by Wilder about three decades ago (1978 to be exact). The RSI indicator serves to warn when a market has been overbought (i.e. risen too much) or is oversold and...

As you can tell by the name, the Commodity Channel Index (CCI) was originally developed with commodities in mind. It’s also used for futures and options. Here it is on the share chart we’ve been looking at – The...