Module 7 – Oscillators and Sentiment Indicators Introduction In this module, we are going beyond the confines of the price chart, and introducing indicators that are calculated in various ways and can show us some element of the...
Module 7 – Oscillators and Sentiment Indicators Introduction In this module, we are going beyond the confines of the price chart, and introducing indicators that are calculated in various ways and can show us some element of the...
Kagi Another charting variation, and the last to be explained in this module, is the Kagi chart. This originates from Japan, and is believed to have been used at the start of the Japanese stock market, in the 1870s. Steve Nison...
Renko Renko is a Japanese term and simply means brick. The Renko charting system has some similarities to the Three Line Break. The plotting procedure again only requires new lines to be drawn when certain conditions are met, so...

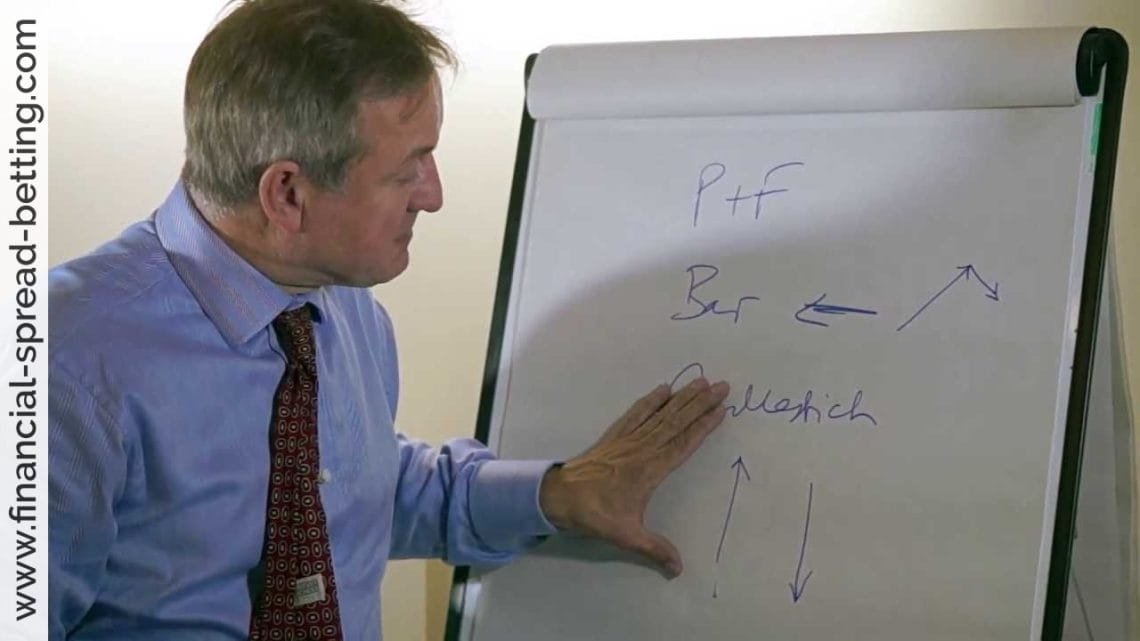
The three line break is a way of looking at charting that some say is more reliable for showing trends, although there is criticism that it usually gives a late signal. It is another system where plotting a further column is...

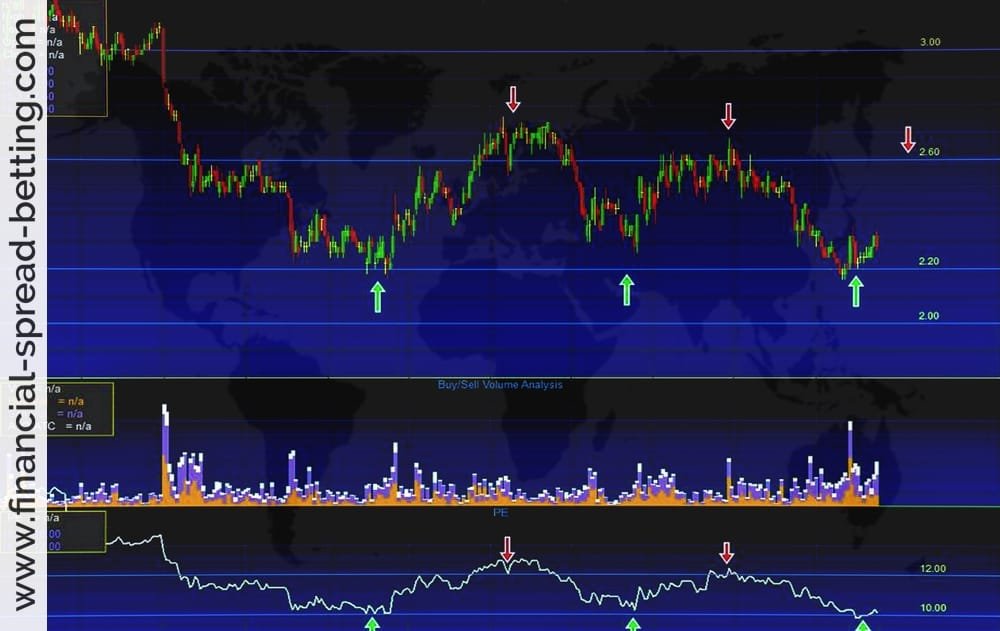
You know how I’m always saying that you have to take account of volume when considering what the market is telling you? Well here’s a clever idea that someone came up with so that you will find it impossible to ignore...
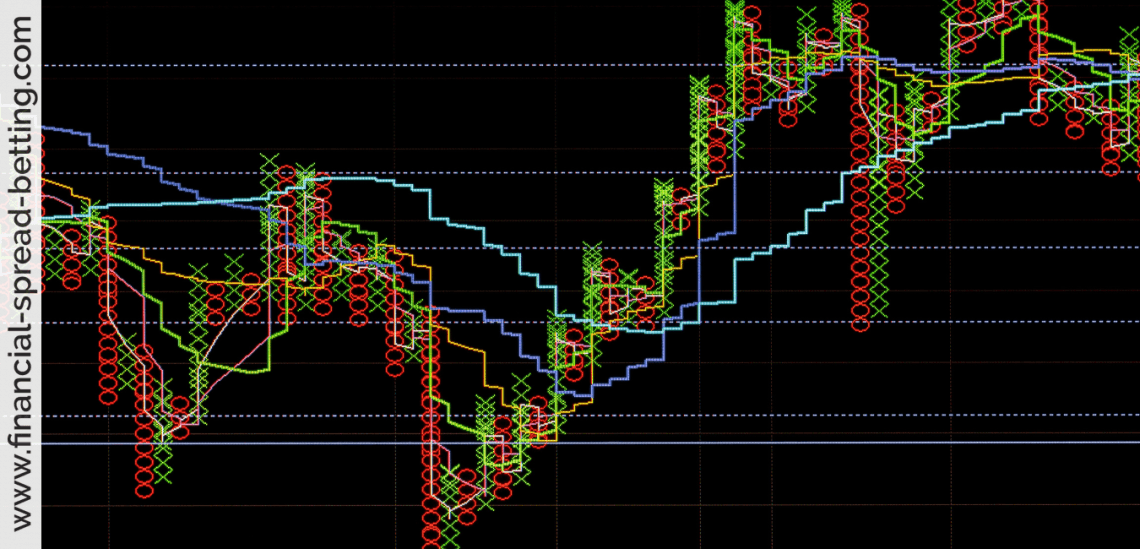
Interpretation Any time you are drawing a column of Xs, and it moves one box higher than the previous column of Xs, this is a breakout. Similarly, when you are drawing Os and the column goes down one box below the previous column...
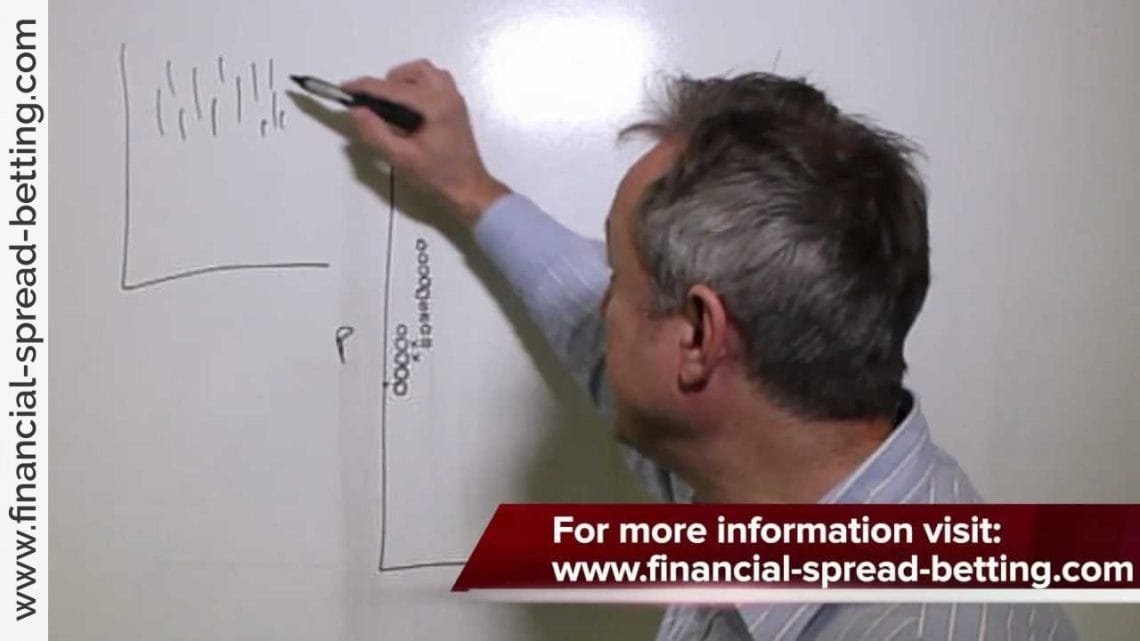
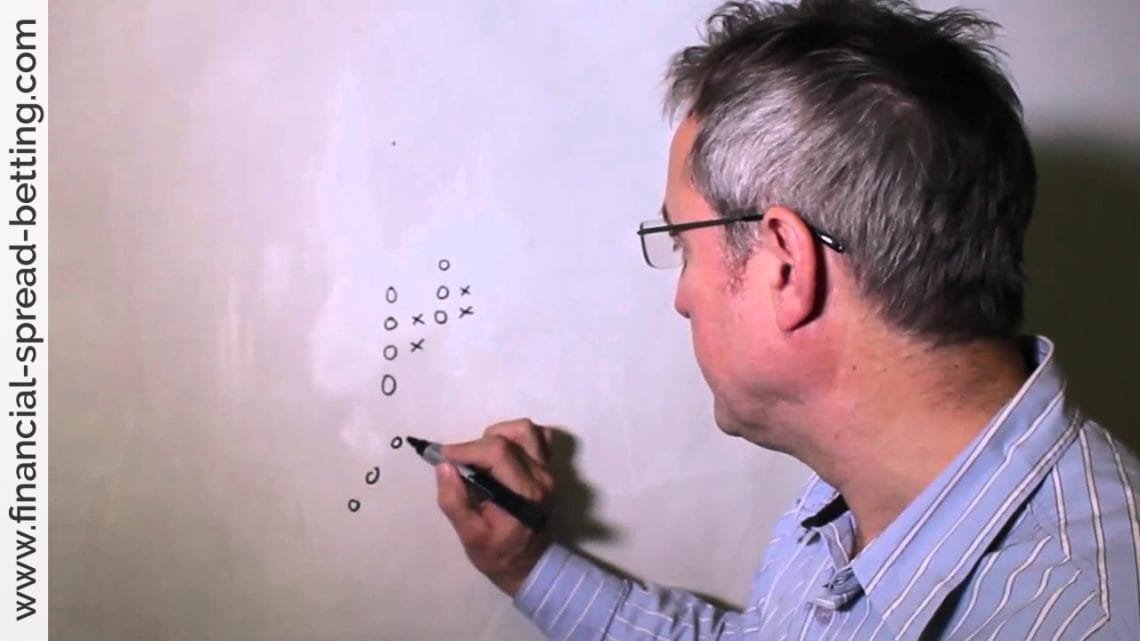
Although the odds are that you won’t use point-and-figure charts unless your charting package will plot them for you, I will go through the manual process so that you understand what you are looking at. First note that the...
In the Western world, point-and-figure charting predates bar charts and candlestick charting. It was first talked about in the 1880s and 1890s, when it was known by the name Charles Dow used, the ‘Book Method’. The...

Pre-qualifying Patterns I mentioned that candlestick patterns should not be traded on in isolation, but in the context of the trend, the chart and the indicators. One way to incorporate this idea is to prequalify or filter on the...
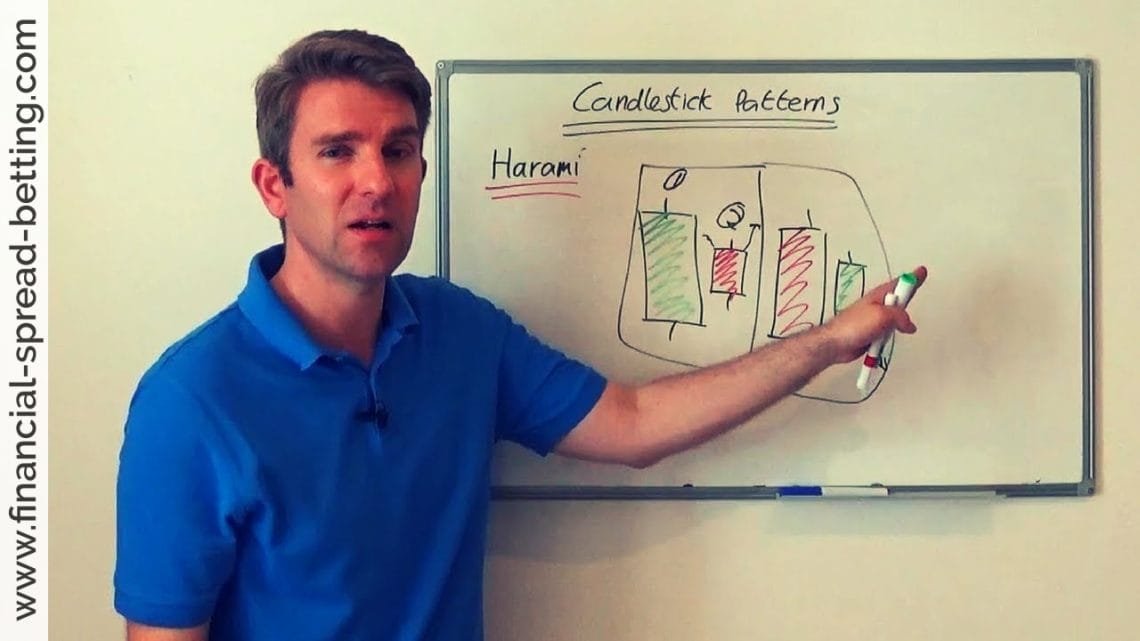
Reversal Patterns Contd. The last two candle reversals we will look at are the Haramis, which means pregnant. This family of patterns includes the Bearish Harami, the Bearish Harami Cross, the Bullish Harami and the Bullish...