Reversal Patterns Candlestick patterns are very useful for spotting reversals but for the setup to mean anything there has to be a trend that is weakening. A reversal pattern is made of one or more candlesticks that often...

Reversal Patterns Candlestick patterns are very useful for spotting reversals but for the setup to mean anything there has to be a trend that is weakening. A reversal pattern is made of one or more candlesticks that often...
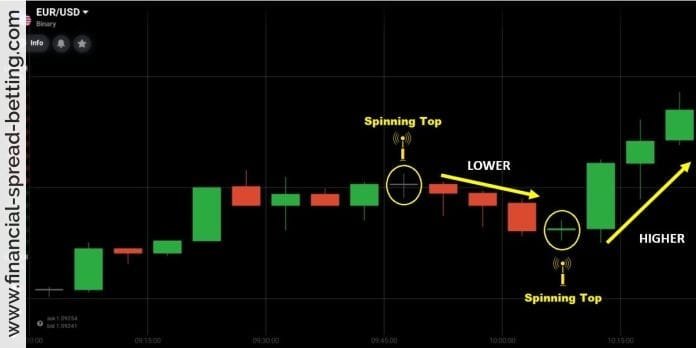
Spinning Tops and Long Bodies Spinning Tops Spinning tops are another variation of a candle. They tend to represent a period of indecision in the market. As can be seen there is a very small body showing not much difference...

Basic Shapes of Candlestick Technical Analysis Patterns The overall length of the candlestick, from wick to wick, is the trading range – daily for the charts I’ll be showing them on, but candlesticks can be used on any...

Module 8 – Further Charting Introduction We covered a lot of what you have to know about charting in Module 2 – but in this Module there is information that will be worth knowing and help in your trading. One of the aspects was...

Moving Average Optimization Traders often discuss optimizing their systems, and with the widespread use of computers it is easy to change variables and back test many times to see if the performance improves. It might well be...

We are due to discuss time cycles in Module 9, where we also consider the Elliott Wave. However, moving averages are bound up in cycles, so I need to mention them here. Many people have observed that prices move in cycles, and...

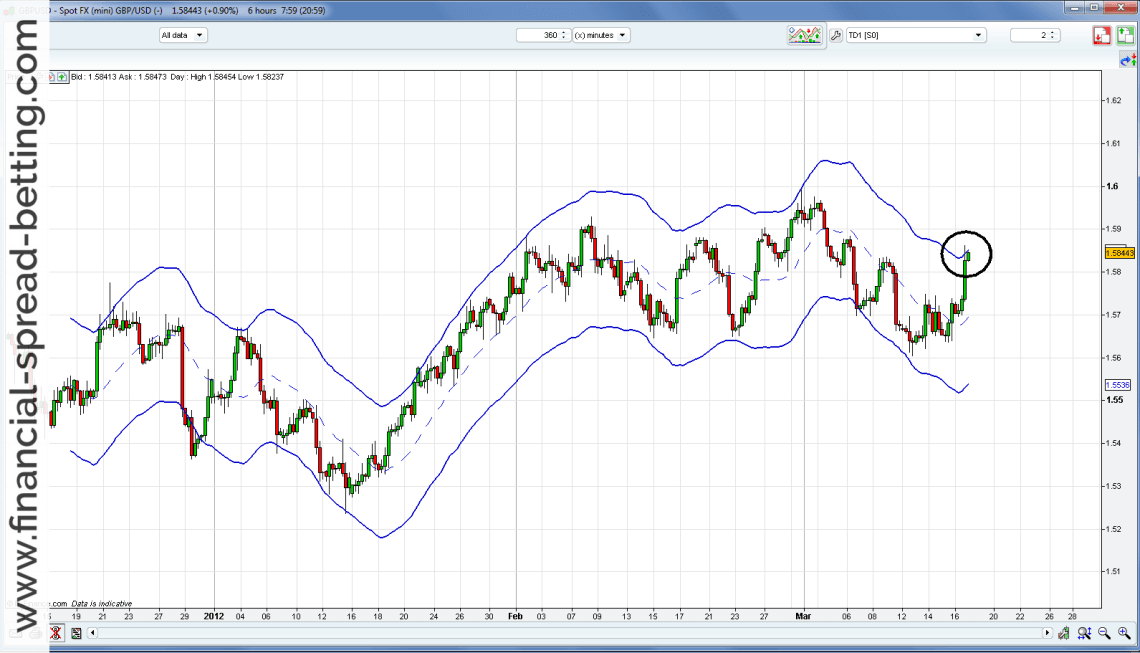
Bollinger Bands are one of the more widely known technical indicators around but least understood. They are also very dynamic and have many uses. Invented by John Bollinger, they are best described as a way to visually measure...
When you are using a single moving average, it can be useful to draw a percentage “envelope” or channel each side of the moving average. This gives you a pictorial representation of where the price may be overextended...

A further development on the crossover method uses three moving averages, and is appropriately named the triple crossover method. It’s just a development of the double crossover method which looks for some confirmation of...
As an alternative, to try and overcome the disadvantages of a single moving average you might look at a system using two moving averages to generate trading signals. This is another commonly used system, and is called the double...