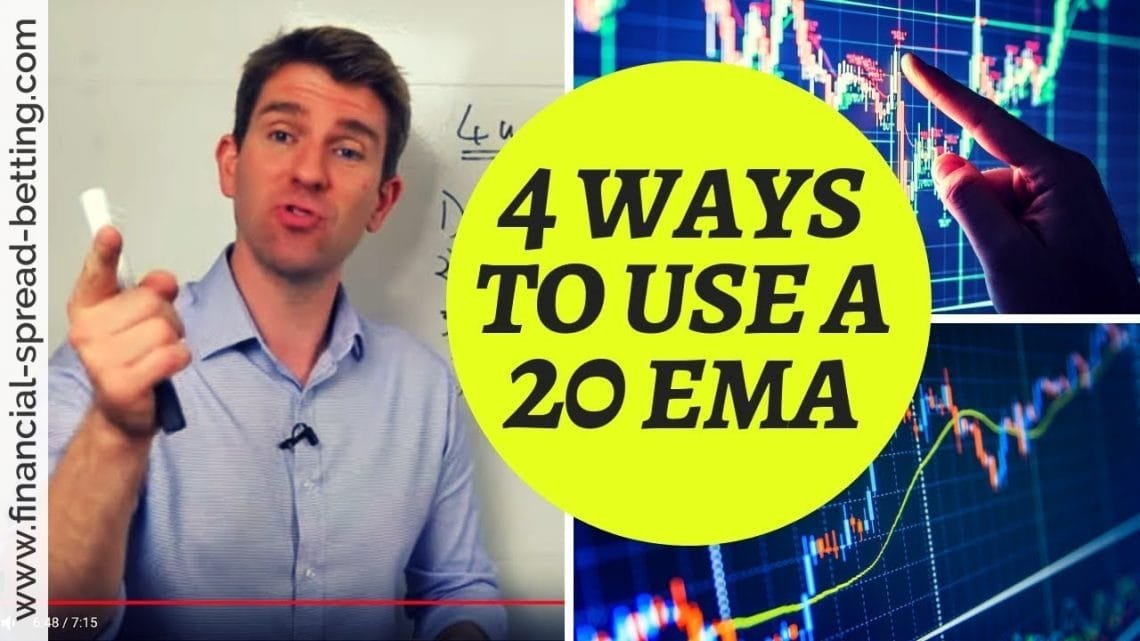
Using one moving average is one of the most fundamental and common basic approaches available for trading. Even with just one, there are still various ways that you can apply it, both for trading signals and to establish a...

Using one moving average is one of the most fundamental and common basic approaches available for trading. Even with just one, there are still various ways that you can apply it, both for trading signals and to establish a...
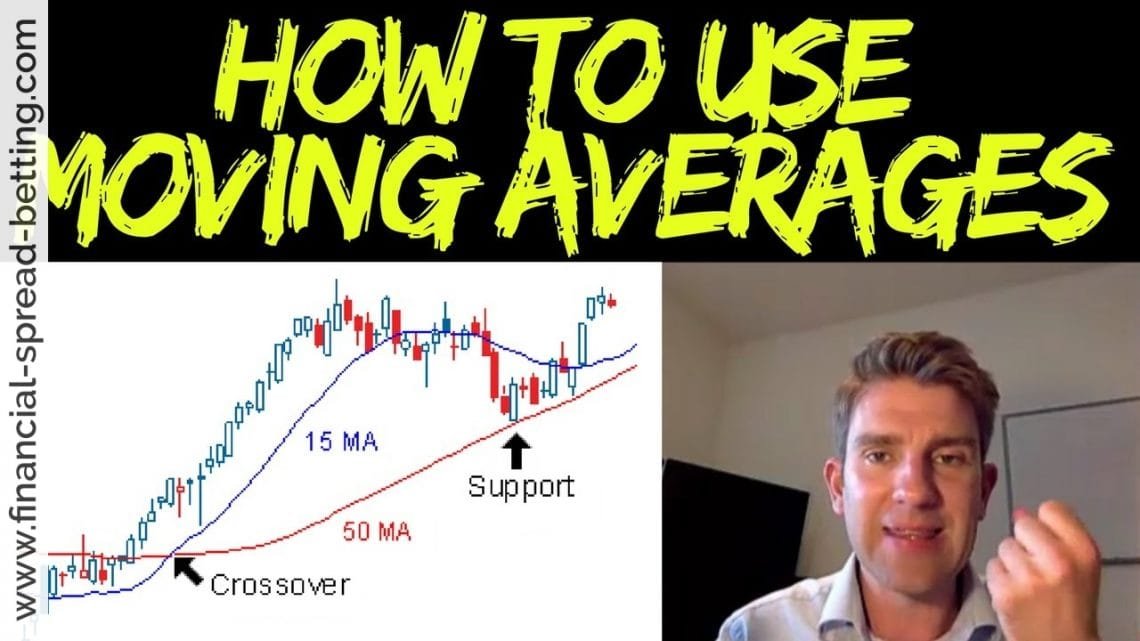
How To Use Moving Averages Moving averages (MAs) are a very versatile indicator that can make trading a lot easier. Let’s briefly discuss what they are and then have a look at the practical applications of them…. What Price...
Moving Averages A moving average is a line drawn on a stock chart representing the average price of a stock over a given period. They smooth out the gyrations in the stock price so that the trend becomes more obvious The most...
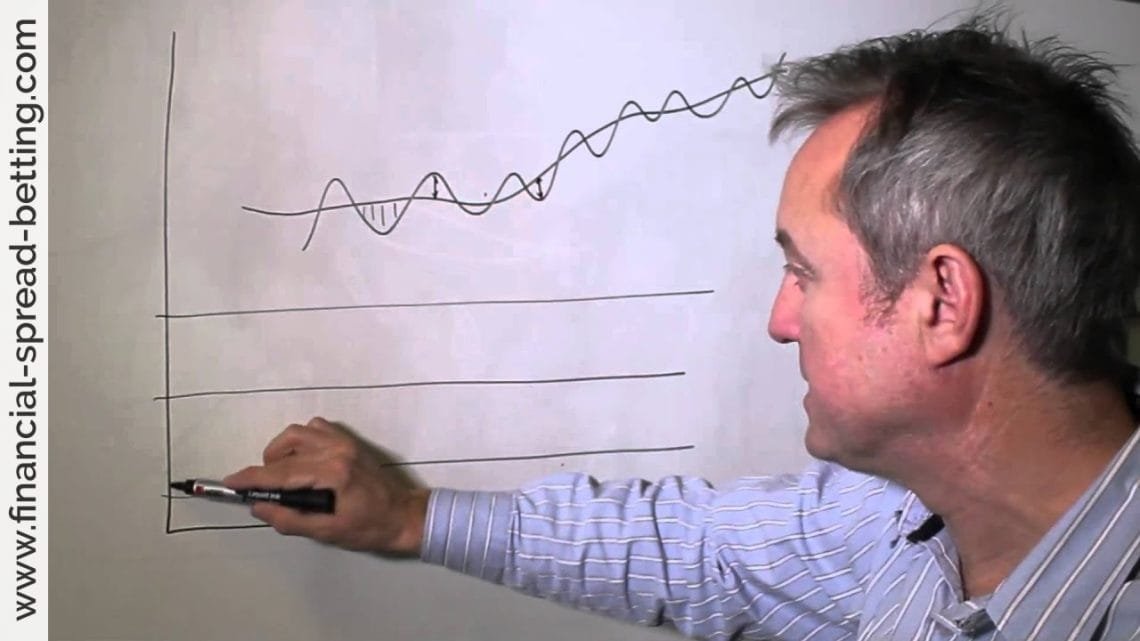
Starting out in financial markets can leave a lot to learn, but moving averages are one of the first methods of assessment new traders pick up, because of the relative simplicity of the system. Introduction The moving average is...
Volume should increase in the direction of the current trend, for it to be sustained Volume often precedes price, so a reducing volume in an uptrend may precede a reversal Divergences between volume indicators and the price chart...
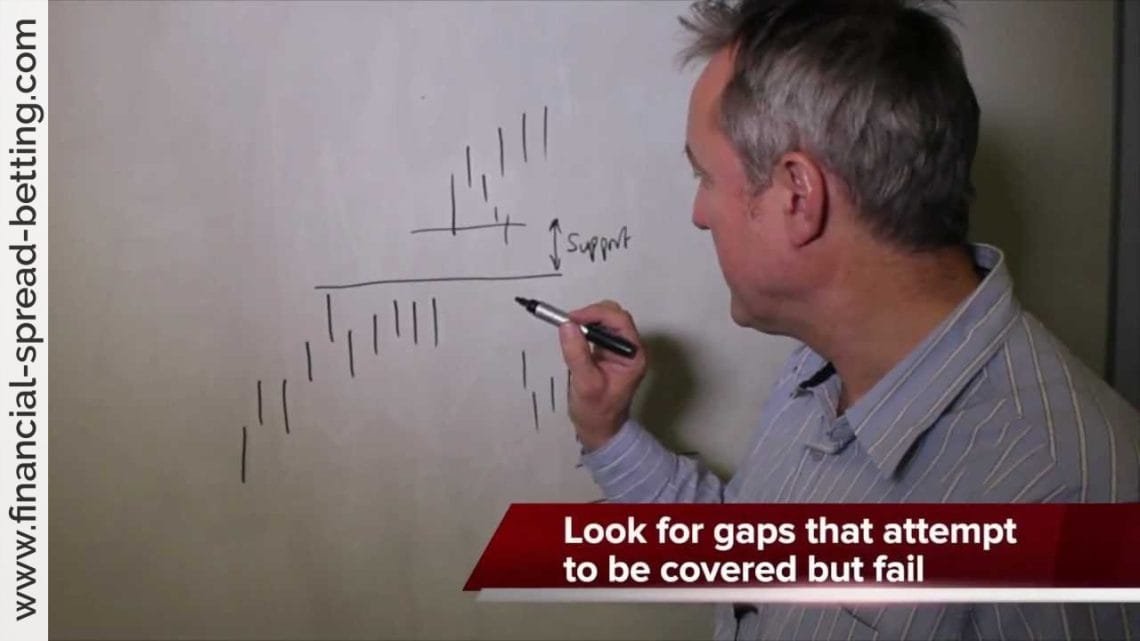
As a final comment on price patterns, I now want to discuss price gaps. I left this topic over from the previous module as it was getting so long. Gaps, as you might expect, are spaces in the price chart where no trading has...
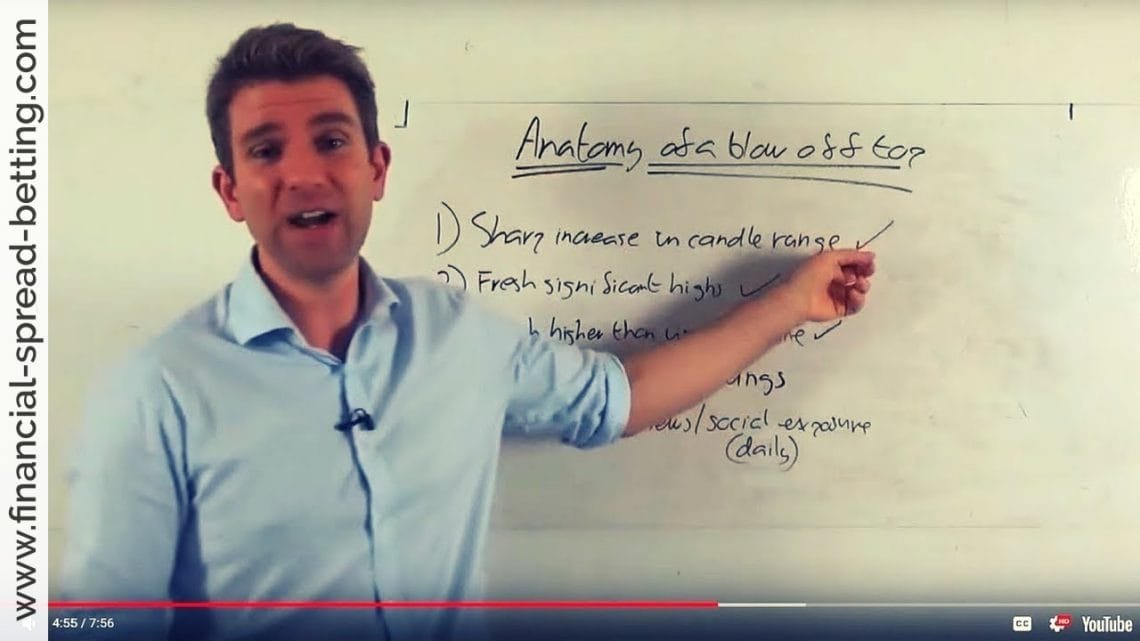
Sometimes called blowoffs and selling climaxes, these are dramatic market actions. The two terms are opposites. Blowoffs happen at market tops, and selling climaxes occur at bottoms. Take a look at the Light Sweet Oil chart...
Options Though I’ve talked mainly about futures when discussing open interest, you can have open interest figures when trading options. They are not quite the same, as contracts in futures markets are a commitment, and open...

So, instead of looking at price movements as the only significant movements on a chart, we can also look at volume and open interest and try to apply this additional information to interpret the mood of the market participants...
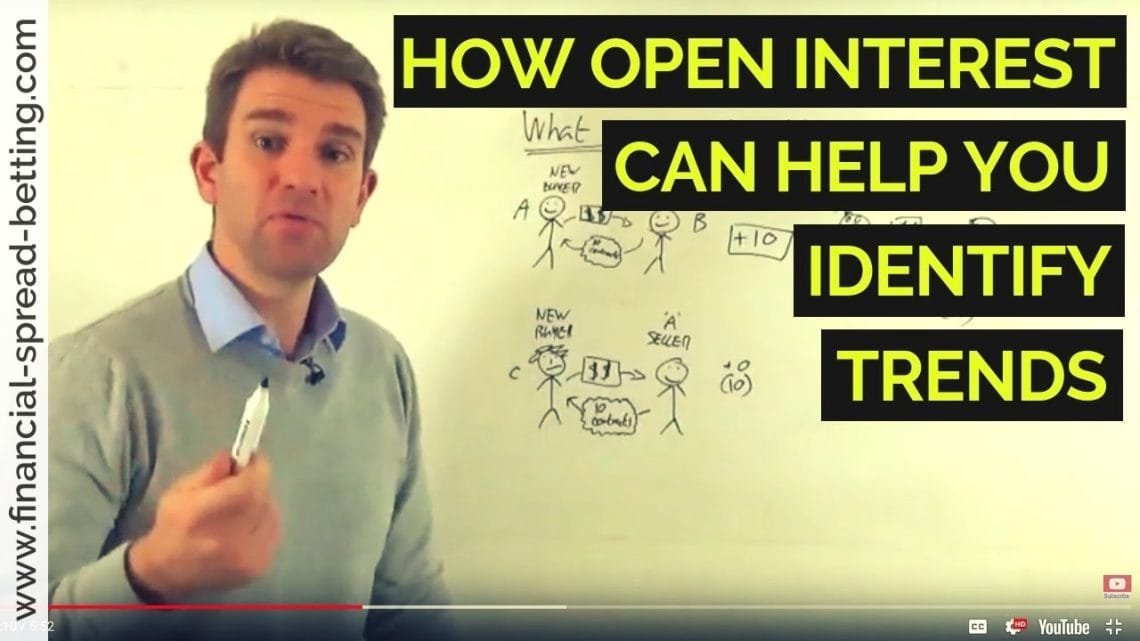
In the same way as we did when looking at volume, we can set out some general rules indicating what open interest means about the strength or weakness of the market. For instance, if prices are rising in an uptrend and total open...