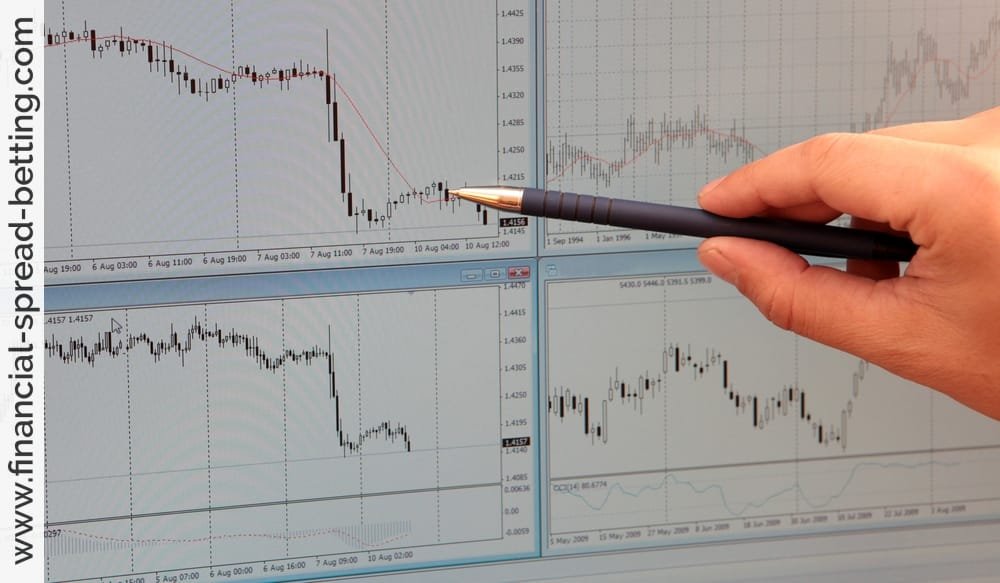
So, instead of looking at price movements as the only significant movements on a chart, we can also look at volume and open interest and try to apply this additional information to interpret the mood of the market participants...

So, instead of looking at price movements as the only significant movements on a chart, we can also look at volume and open interest and try to apply this additional information to interpret the mood of the market participants...
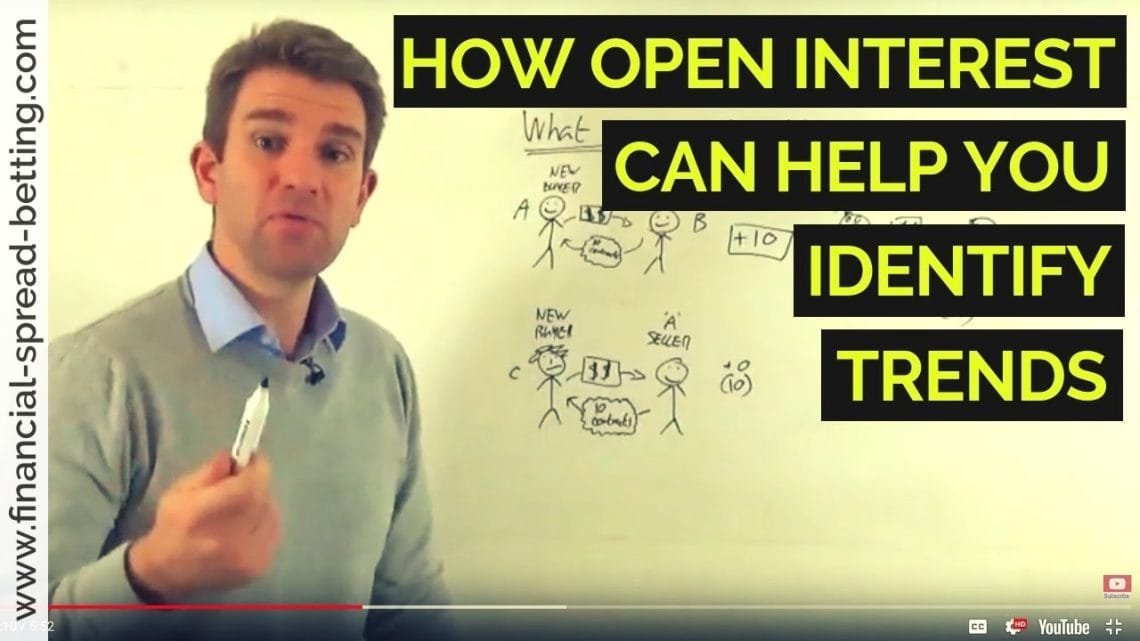
In the same way as we did when looking at volume, we can set out some general rules indicating what open interest means about the strength or weakness of the market. For instance, if prices are rising in an uptrend and total open...
Open interest is a term used in futures and options, and is a count of the number of contracts outstanding. You will recall that futures or commodities are traded with a large amount of leverage or gearing, which means you do not...
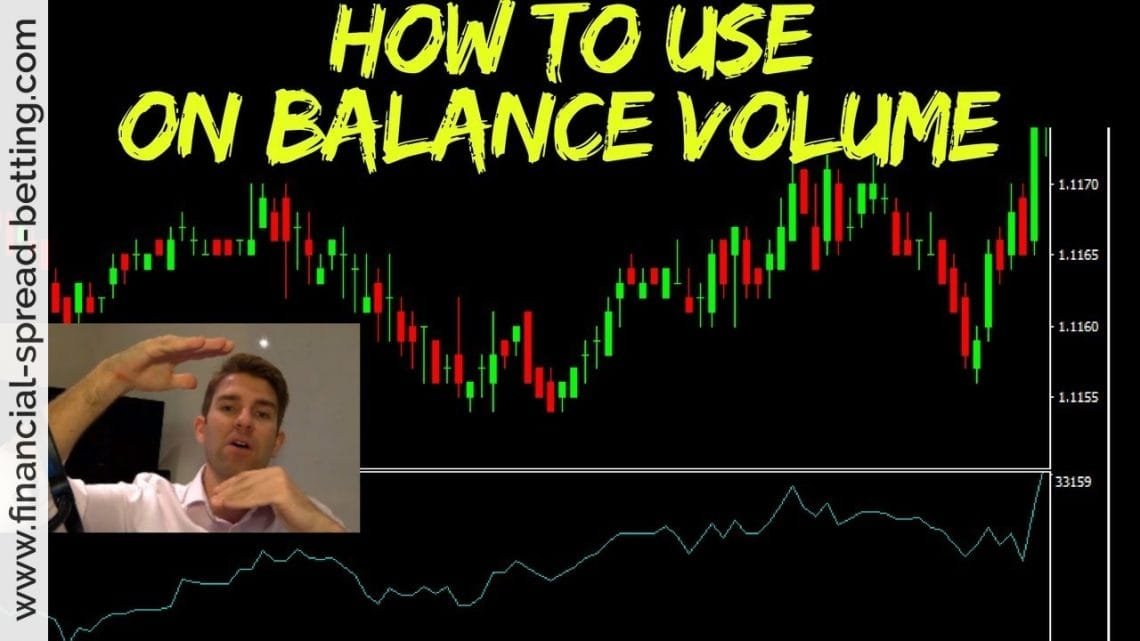
As an alternative to looking at volume bars and trying to gauge the buying or selling pressure from that, technical analysts can also use an indicator called the On Balance Volume or OBV. This was developed nearly 50 years ago by...
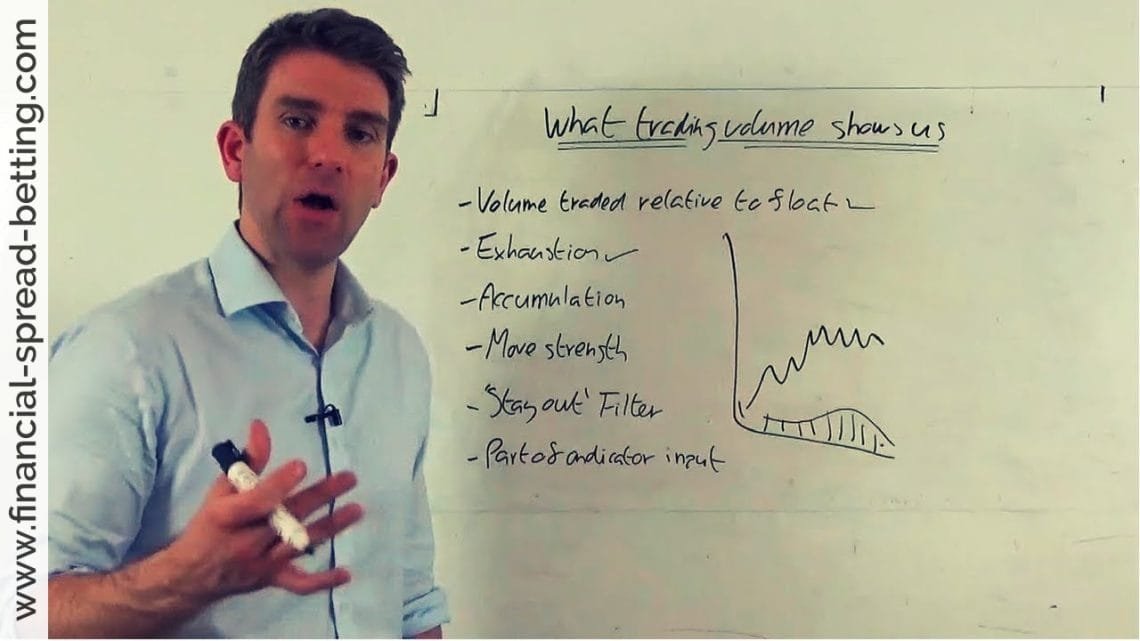
Module 5 – Volume and Open Interest Introduction As I said in the first module, there are two or three factors that are the basis of technical analysis. These are price, volume and – for futures and options – open interest. Our...
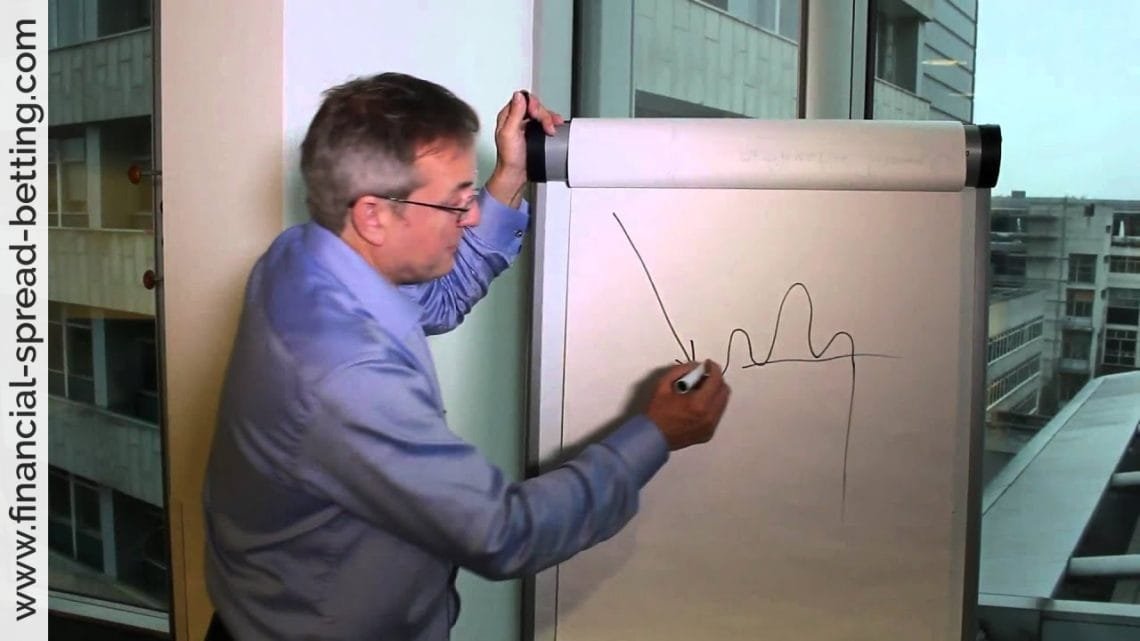
The head and shoulders pattern can signal a continuation rather than a reversal, although it appears in this role rather less. Fortunately, you are not likely to get them confused, because the head and shoulders continuation...
The measured move, which can also be called swing measurement, is a simple observation that some market moves are made in two equal parts, with a retracement of 33% or 50% in the middle. It can give you a price target after an...
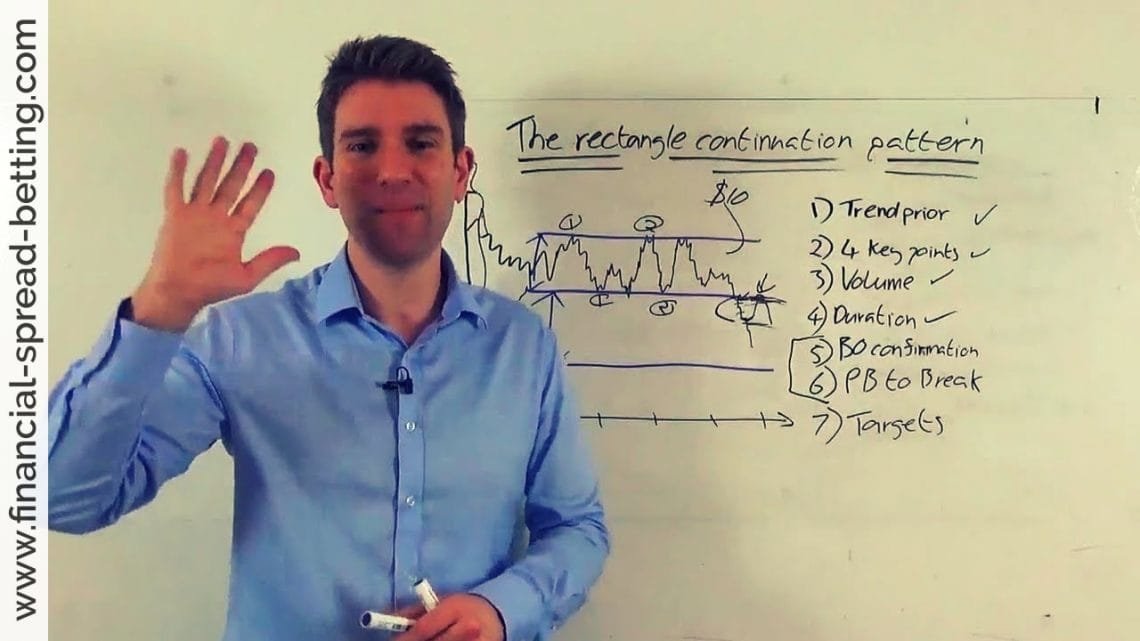
The rectangle pattern goes by several other names, and is distinctive enough to spot easily on a price chart. You may recognize it as what Dow called a line, and it is also referred to as “trading in a range” or as a...
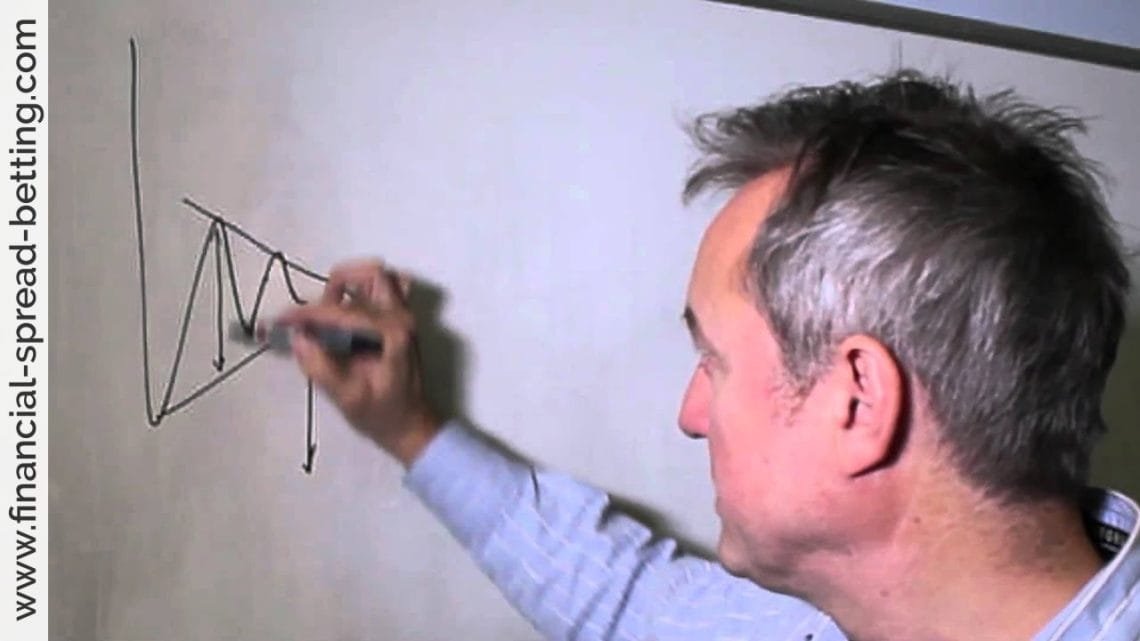
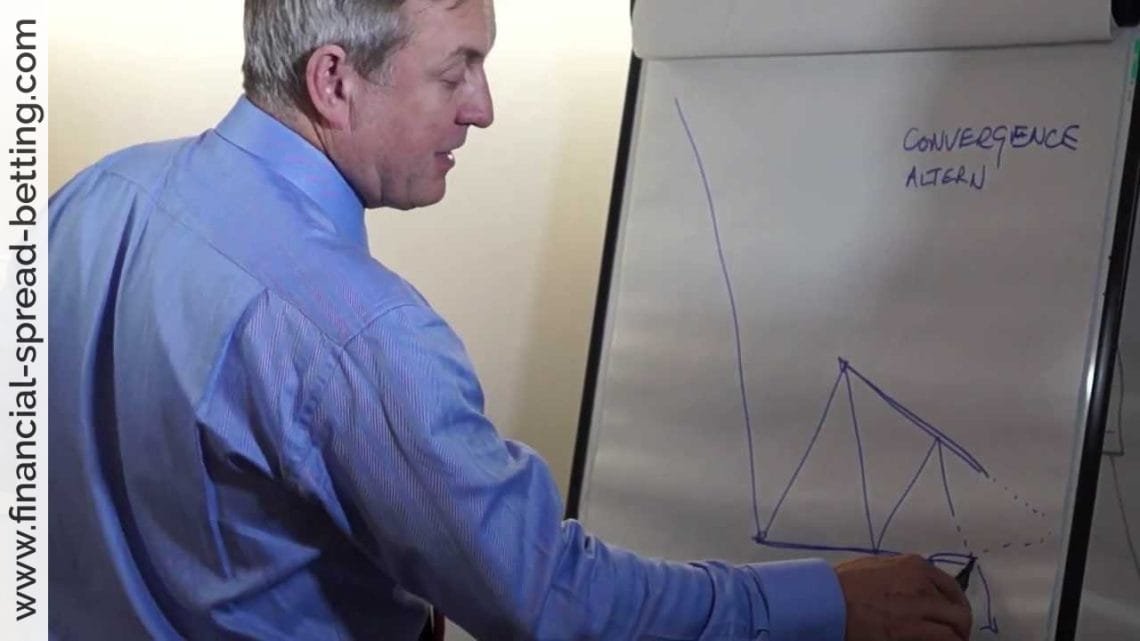
The wedge pattern can occur in either uptrends or downtrends, and is another type of triangular shape that captures the price movement for a time. It looks just the same as any of the other three (converging) triangles with the...
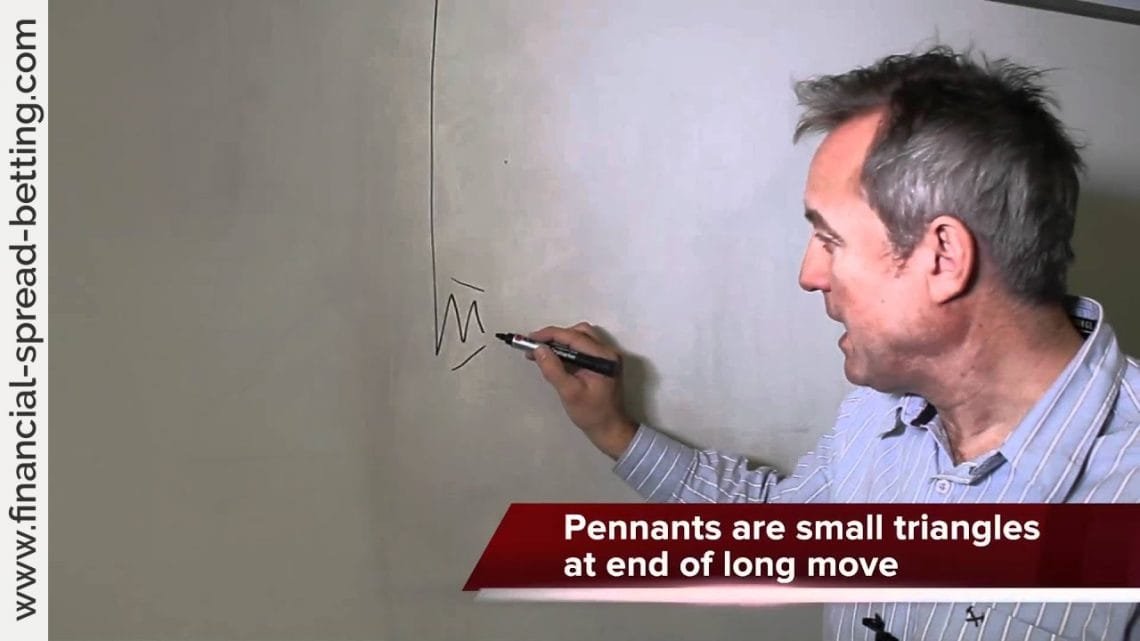
The flag and the pennant are different continuation patterns, but I put them together here as they have the same characteristics and usually are seen in the same context. They can form after a sudden, sharp rise in the stock...