

A: Support and resistance levels are amongst some of the most common technical analysis tools. These consist of price points that the market consistently hits and then reverses direction. Support refers to points on a chart where the price drops to before rising, while resistance refers to points that the price rises to before retracting.
Market forces dictate price supply and demand. Price is driven by people just like you and me who succumb to the same human emotions of 'hope, greed and fear' as anyone else. Seeing where previous highs and lows have occurred in the past and how the market has behaved when at these levels can give clues as to what might happen next. Traders can formulate a number of strategies using 'what if' scenarios.
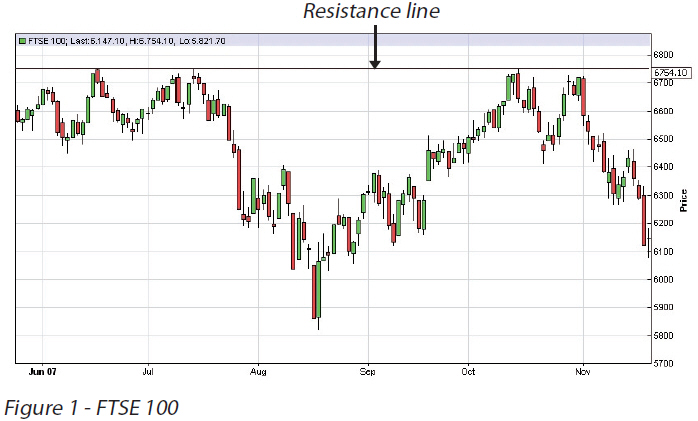
If you look carefully at the FTSE chart below you can immediately see that there seems to be considerable resistance to the market going higher above 6750. Based on this information you can see that the market doesn't seem to have the impetus to move above this
particular level. As such, you can deduce that being long (buying) at these sorts of levels is probably too expensive, and that you can probably buy at cheaper levels later. We are not concerned with the whys or hows - it is simply sufficient that there appears to be a barrier at this level. You can also consider short-selling the market at these high levels around 6700 as historically it looks good value to do so.
Resistance: An area to the left of the share where sellers have appeared before.
Resistance is basically a level where traders believe that the stock is overpriced and no one will be looking to buy at or above this point. When a stock is reaching a resistance which is plotted along the peaks of a trade over a given period, we can expect the stock to fall or retrace and perhaps fall to usually a 3rd of the points between the last confirmed low.
So why is it useful? All I can point out to that most share price movements are based on support and resistance, and if you can identify those areas of support and resistance your trading decisions will become better.
I think of resistance as a fence in the Grand National, sometimes a horse may fall and that race is over, or he may refuse at a fence and then jump it the next time, or the horse may jump the fence but fall on landing, or he may sail over the fence and be ready to meet the next fence.
 |
A resistance level is an area above the current price where selling power overtakes buying power.
Remember there will still be lots of people out there who do not look for support and resistance levels so shares can trade thru these areas, so do not be over strict, also spread bet firms know of these levels and it is in their interest to take out as many stop losses as they can, so the share price can be driven thru these levels only to recover later during the trading day.
Resistance should become support and vice versa, if the Dow is crashing support doesn't help much until it finds a level of support that works.
A:
There are several methods; one of which is to look at a bar chart and check at what price levels - the highs, lows and closing levels appear to be touching the most. This works on any timeframe (be it hourly, daily, weekly, monthly or yearly) and in most instances you will find that a cluster of 'highs' or 'lows' will be crowded in a small price area without any particular price level. In such cases you can consider this area of be a support or resistance zone.
Another method is to look at major price tops or bottoms which represent important resistance and support levels. Price gaps on charts can also be considered as support and resistance areas. It is also quite useful here to draw trendlines and project them to reveal possible future trend line support and resistance points.
Moreover, once a key support level has been breached, that level is likely to become a key resistance point or zone. Similarly, a major resistance level that is ruptured on the upside will in most cases become a key support level.
Even another way to find out support and resistance areas is to look for major retracements that oppose a current price trend. These moves are sometimes referred to as a correction. For instance, let's assume that a share is solidly trading in an uptrend. The trend started at the 200p price level and the share price rallied to 400p before pausing and pulling back to 300p after which the price rallied even higher. This represents a 50% retracement of the original move from 200p to 400p. The 300p level thus represents a support level so the 50% retracement level proved itself to be a solid support point since prices dropped by 50% and then continued to rally. The same can be said about downtrends and temporary reversals to the upside.
There are a few preset retracement percentages that have been proven to work well at finding support and resistance levels. These are: 33%, 50% and 67%. There are also two other percentage numbers at 38% and 62%; these last are referred to as Fibonacci numbers (Fibonacci was a quant). These 5 numbers are the ones that most technical analysts use to determine support or resistance levels and many of the charting software programmes have these percentages as presets (so all you would have to do would be to locate with your mouse the start of a trend and then point to a high and the percentage retracements will be laid out to the right on a chart).
One other way to determine support and resistance levels is using geometric angles from a certain price point; W.D.Gann, a famous stock trader invented this method while using the same 5 numbers above to calculate his angles (again, most software chart packages will have this preset to allow you to plot angles on charts).
Lastly, support and resistance levels can also depend on 'psychological' price levels which usually consist of round numbers. For instance for the Dow 10,000 would be a psychological level.
 |
The content of this site is copyright 2016 Financial Spread Betting Ltd. Please contact us if you wish to reproduce any of it.