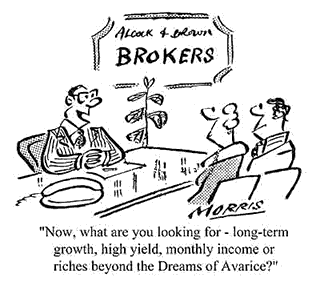
As mentioned earlier, you need to study the form before you plunge into the market. This means reading the financial section of your newspaper regularly. If you don't buy or have access to the Financial Times every day (your local library will probably keep copies) then you should get a copy at least once a week. I find the Saturday edition the most interesting because it is slanted more towards the personal investor. As for financial magazines there is the weekly Investor's Chronicle and several others to choose from.
 |
Before you turn to the news items, the reports of company meetings and the feature articles you need to know how to read the current prices. Here is an example of a share list.
| Typical CGT Calculation | ||||||||
| High | Low | Company | Price | + or - | Div | Cover | Yield | P/E |
| p | p | p | p | p | p | % | ||
| 204 | 180 | J. Sloucher | 200 | +2 | 20 | 2 | 3.5 | 15.6 |
The first two columns show the highest and lowest prices the shares have been during the current year. Then comes the name of the company and the price based on the previous day's dealings. It may not be the closing price, because some newspapers set up their lists earlier in the afternoon.
The price quoted is the middle price. There are actually two prices in the market; the buying price and the selling price and the difference between the two represents the dealer's commission. This margin depends largely on the price of the share and how actively it is traded.
For example, the margin on a popular share standing around £10 would be about 10p, so the broker might quote you 1010p to 1020p. In other words he can buy for you at 1020p and sell at 1010p. In this case the newspaper would quote the middle price of 1015p.
The next column shows how much the shares went up or down compared with the price quoted on the previous day.
Then comes the cover which shows the extent to which a company's dividend is exceeded by its earnings (profits).
For example, if a company pays a dividend of 20p a share, but had enough profits to pay 40p a share, then the dividend would have been covered twice. The higher the cover the more scope there is for the company to pay out more dividend to its shareholders. Where cover is less than once, you may have reason to suspect that future dividends are in doubt.
The yield is the percentage return a shareholder receives as a dividend on every £100 invested in the company. This is calculated by multiplying the gross dividend by 100 and dividing it by the current share price. For example, if the gross dividend was 10p per share and the share price was 200p the yield would be 5%. If the shares rocketed to 400p and the dividend was not increased the yield would fall to 2.5%. Of course, the lucky investor who was wise enough to buy the shares at 200p would still be getting a 5% yield on his money.
The dividend yield is heavily dependent on the company's pay out policy and is therefore not a very good measure of the company's ranking. Remember too, that as with all types of investment the general rule is the higher the yield the greater the risk.
The last column headed P/E refers to the price earnings ratio which is one of the most important yardsticks used to measure the merits of one share against another. It shows how the company is rated in relation to the profits it earns.
It is calculated by taking the current profits (often called earnings) of the company and dividing it by the number of shares issued. For this purpose earnings are defined as profits after tax, less interest payments and dividends to preference shares. This gives an earnings per share figure which is then divided into the current share price to give the P/E ratio. For example, a company with a quoted share price of 300p and earnings of 25p per share would have a P/E ratio of 12.
The figure shows the extent to which the share price is supported by the earnings. The higher the P/E ratio the greater the expectation the market has that profits will rise; buyers normally regard a company with a high P/E ratio as a high flyer and they are therefore willing to pay a comparatively high price for potential future profits. A low P/E ratio indicates that the market regards the company as dull and unlikely to improve its profit record.
The market could have got it wrong and a low P/E may mean that the share is undervalued and represents a good buy. The skill is to judge whether a share's P/E is over or underrating its potential.
It follows that near the top of a bull market P/E ratios are generally high while at the bottom of a bear market they are low.
Please do not copy/paste this content without permission. If you want to use any of it on your website contact us via email traderATfinancial-spread-betting.com (remove the AT and substitute by @).