Higher Highs and Lower Lows
This is really easy to grasp. When there is a higher High, in another words when the price closed higher than the day before, this is a signal of greater confidence and a possible trend for further higher prices. On the flip side when there is a lower Low, this suggests that confidence is lowering and the price will fall.
In fact there are many books & courses that use this technique alone. Which to me is putting way too much trust in one signal. Plus, I think that a whole course based on what I have covered in one paragraph is somewhat of an overkill.
Just remember the above higher High and lower Lows to add extra weight to your trading decisions. As I have said before, this gives us just a bit of extra security in making sure that we have made the correct choice in trading Long or Short.
We haven’t finished by any means yet. My system has worked well for me for a long time. The moving averages above give me a clear graphical representation of price trends. The above higher Highs etc. clarify visually also that there is extra evidence to trade Long or Short. However I also add a few more signals that I have used for a long time that add even more argument to trading either Long or Short.
They are additional items that are once again freely available on most charting software and services. These additional tools are to be used to clarify a decision, nothing more. Not one tool is used on its own to signal a trade. It is the combination of our Moving Averages and all the extra visual tips and tools that we use.
I shall be covering these extra tools and techniques in the next few pages. Followed by a quick crash course in standard Technical Analysis. Nothing heavy or to worry about, just extra tips and tricks that will allow you to add even more weight to your trading decisions.
Clear Upward Channel Points The Way
Let’s take a look at Morgan Stanley’s share chart and see what that tells us about what the share price might do over the coming months. We can see that since last October / November the stock is in a clear uptrend. We can see from the chart below (click to enlarge) that the stock has being trading in a channel, defined by a series of higher highs and higher lows.
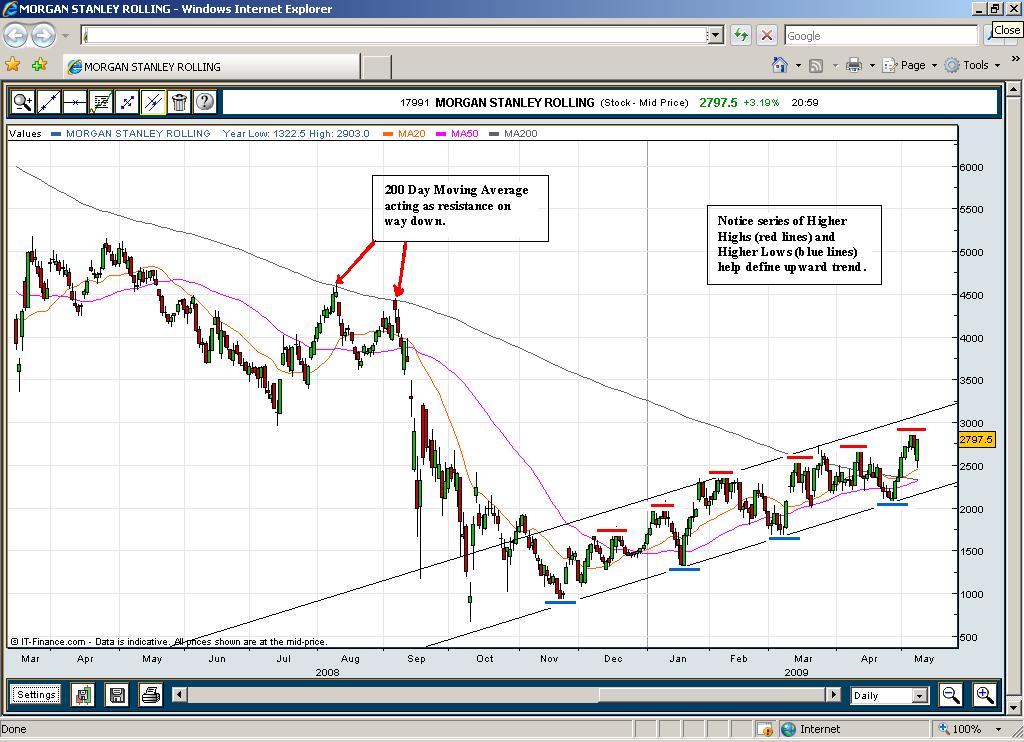
The concept of “higher highs and higher lows” is a commonly used technical trading term which I wanted to introduce this week, and one of the main reasons why I decided to pick Morgan Stanley for this week’s “Chart of the Week” post over the various other US banking stocks I looked at. Stocks whose charts are showing a series of higher highs (defined by the price reaching a new high each time it trades up – see red lines marked on chart) and higher lows (defined by the price staying above the previous low it made the last time it traded downwards – see blue lines marked on chart) are by default going to be in an uptrend. What technical traders like about these kind of trades is that:
- They can time their entry point using the channel, be that buying when the stock hits the bottom of the channel or shorting when its near the top. Note: Shorting stocks in an uptrend like this, even if they are in a trading channel and due a pullback, is risky as the overall direction of the stock is upwards.
- They can easily define their risk by putting their stop just below the previous higher low. If the stock falls below the previous higher low it has effectively broken out of the upward trend, at least temporarily and from a trading perspective you no longer want to be long the stock.
- Similar to defining their risk, they can also identify logical profit taking levels when the stock moves back up to the top of the range and use these levels to tighten up their stops.
Looking at some of the other technicals for the stock, it has a rising 20 and 50 day moving average and recently broke through its 200 day moving average. This 200 day moving average (approx 2330) may well act as support going forward. In its fall from over $90 a share in June 2007 the 200 day moving average acted as resistance on a number of occasions so if this breakout can hold it could turn out to be quite significant. Any pullback to the 200 day moving average holding would also see another “higher low” be put in place. Any long trades should have a stop just below this area. On the upward side, the next big area for the stock to clear would appear to be $30. A close above this point would see a new “higher high” and would keep the bullish upward trend intact.
Join the discussion