Commodity Corner – the Gold uptrend is Spluttering…?
Jan 7, 2013 at 10:45 pm in Fundamental Analysis by Dave
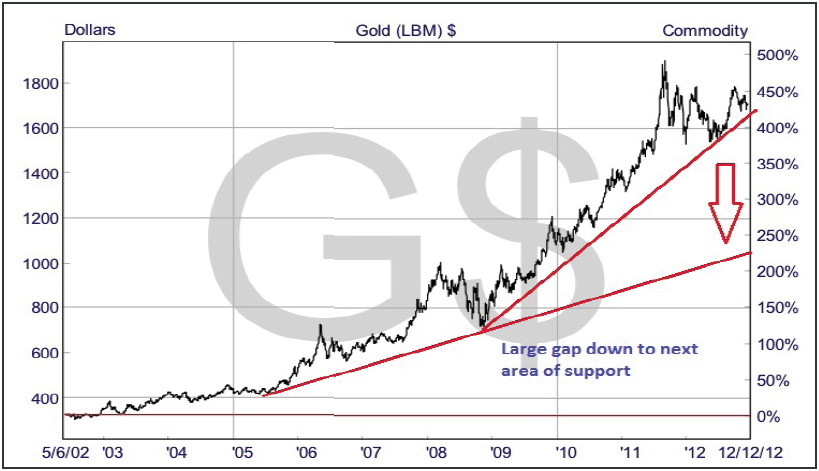
Gold has most certainly been in an impressive uptrend for the last 15 years. In fact, pretty much from the point when probably the UK’s most ineffectual Prime Minister, Gordon Brown, sold almost all our stock in the late 90’s at around $250! Since his infamous “sale of the century”, gold has run from just under $300 to a record level of $1,900 last year.
There have been two key drivers of the uptrend and one has been the rising demand from countries like China and India which, together, represent as much as 50% of the total physical demand for the precious metal. As a consequence of the serious growth these BRIC countries have experienced during the last 10 years, their orders for gold have certainly been making gold bugs very happy indeed, resulting in a seemingly never-ending bull market. Unfortunately, in the markets, more often than not, what goes up generally comes down as the weight of bulls in a position gets top heavy and then prices deflate…
During 2012, gold has been absent the physical demand driver and, even though its price has risen modestly, the trend has not been as linear as in prior years. In the process, this has scared some investors given the sharpness of some of the sporadic declines. Are we approaching a peak in the gold market as this type of trading pattern typically signals, or is the trend just pausing, ready for a renewed ascent?
Physical Demand
It seems that many of the gold bulls have forgotten the simple laws of supply and demand and, at a physical level, demand for gold has been waning in the last 18 months with Indian and Chinese market participants openly stating that the current spot price is too high. This leaves financial demand from ETF’s and investment funds (and of course John Paulson!) to support prices. With the exit from the extraordinary monetary easing in sight in the US following continued evidence of strength in the economy, movements in interest rate futures in the US are our smoke signal that gold is likely to retrace at least half the gains seen during the last 15 years (a typical retracement of a bull run) and revert back to $1000-1200 which is, of course, where physical demand comes in again…
Selling begets selling too, and should gold take out the $1600 level, then we’d expect a crescendo of selling by the investment and hedge funds that are carrying the bull positions as the trend reverses decisively. Remember too that gold pays no yield and so when holding gold you actually have real carrying costs of storage and insurance. The only return to those exposed to gold is capital return and so if gold falls in price there is no reason to hold.
With China no longer growing at the blistering near double digit rates of recent years, and more likely around 6-7% in future as it attempts to re balance the economy from inefficient investment projects to domestic consumption, the China-gold underpinning story is also crumbling. India’s growth rate is also similarly slowing and so a declining GDP growth rate here takes away another of the “investment” case stories wheeled out by the gold bugs…
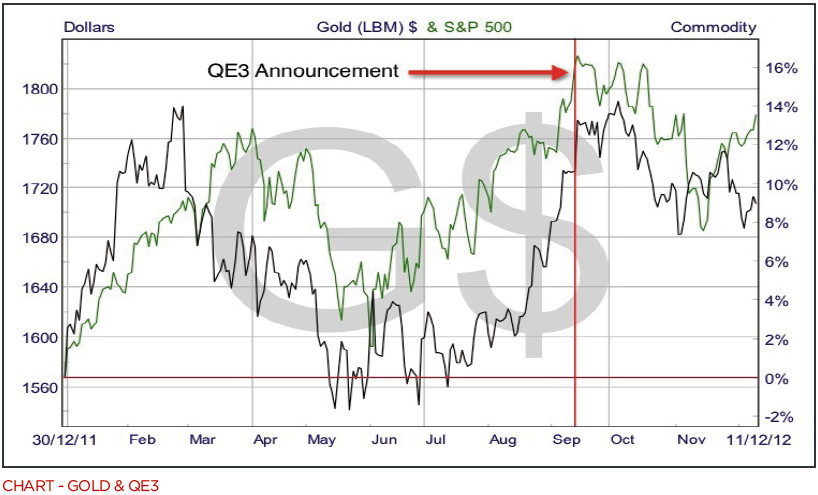
To be sure, gold is, at the time of writing, still 9% up on the year and has been one of the better performing asset classes as the table below shows, but this masks some hairy negative periods. Between Feb 28 and May 28, a three month interval, gold declined almost 9% reflecting a drop in international physical demand that occurred in quarter two. It recovered in quarter three as physical demand modestly recovered. As we can see from the chart below, however, the market does not seem to be buying the “inflation hedge” story any more, as since the QE3 announcement, gold has actually fallen in price.
A Second Component of Physical Demand
Besides the physical demand for gold from China and India, the exchange-traded funds (ETFs) and also Central Banks around the world have been buying up gold stocks at an increasing pace during the last 10 years. Investors have been searching for alternate assets as hedges against inflation given the continued debasement of the monetary base in the US in particular. The ETF funds have sounded additional warning shots to the bulls this year, however, through being reduced buyers and ditto with the Central Banks — both these factors have weighed on the gold price and are likely to continue to do so based on current trends.
Quantitative Easing and the End Game
In order to fight the raging global economic fire that was the Great Financial Crisis occurring 2007/8, Central Banks embarked upon what any good fireman would do to extinguish a fire — they doused the global economy with liquidity. Interest rates came down to near zero levels and massive asset purchase programs were announced. The U.S. Federal Reserve alone is now on its third round of quantitative easing and is expected to inject in excess of another trillion dollars into the domestic economy through more bond purchasing. The FED’s balance sheet now runs to over $3tn.
There are unmistakable signs in the US that Quantitative Easing and its dampening effect on mortgage rates is having a positive effect on the housing sector, although its effect on stock prices has been much more muted of late. The FED is able to continue with the liquidity spigots fully open as the inflation bogeyman has yet to rear its head, and so “Helicopter” Ben still has latitude to ease. Indeed, the employment market in the US has begun to stir again during the last 18 months. One thing is for sure, however, and that is if the housing and labour markets continue on their current trajectory, then, ultimately, and perhaps sooner than the market thinks, this will ignite inflation. And this is the central fundamental point of our bearish stance on gold — the US monetary easing program is closer to the end than the beginning and we expect in late 2013 (a full 18 months ahead of the markets current expectations) that the FED will begin to exit their QE programs and nudge interest rates up. This will be a hammer blow to gold as the relative attractiveness of bonds, in particular, increases with higher yields. After all, why hold a non-income producing asset that actually costs you to hold, particularly when the capital growth side has vanished?
What to Expect in 2013
We expect global growth to continue to build momentum through 2013, led primarily by China and the US — the two major global economic locomotives. If we are right, and the turn in the US interest rate cycle is much closer than the consensus thinks, then gold will almost certainly take a hard knock.
Since the start of the bull-run in the late 90’s there has not been a sustained period of major underperformance and, given the length of the bull-run, this is very rare. The current chart structure looks ominously like a topping formation to us and we are almost a lone dissenting voice in our call for gold weakness — a stance we find comfort in. To be sure, a Grexit from the Euro next year would likely cause a knee jerk run to safety and gold would likely benefit under such a scenario. This would be our cue to implement a secondary short during 2013.
We think gold overbought, over owned and exposed to continued weakness. A brave call for 2013, but one in which we have a high conviction with regards to expectations of further weakness.
Article reproduced from the January edition of Spread Betting eMagazine