Ascending Triangle
The Ascending Triangle is one of my favorite patterns to trade. It is a bullish chart pattern that may form when a share holder begins selling off a large block of shares at a fixed price to the market. The pattern shows the case of strong overhead supply being met by rising demand for the stock. If the demand persists, the supply will eventually be absorbed leaving the price free to move in the upward direction. Ascending Triangles are easily recognized and when interpreded correctly, tend to be reliable patterns to trade.
Both the ascending and descending triangles, while looking very similar to the symmetrical triangle, are much more specific in their implications for the trend. The symmetrical triangle is neutral, and that cannot be said of the ascending or descending triangles.
Notes that the upward trendline of the ascending triangle is horizontal, while the lower trendline rises to meet it. The ascending triangle is definitely bullish, and that applies whenever it occurs. This is in contrast to the symmetrical triangle we just looked at, which has a neutral effect. Usually the ascending triangle will be seen in an uptrend and is therefore interpreted as a continuation pattern, but sometimes it can be seen in a downtrend when it is a bottoming pattern, and may signal a reverse. Here’s the pattern again –
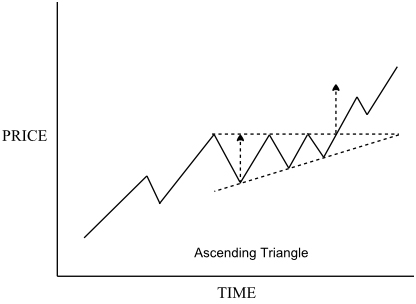
Going back to the discussion on support and resistance, you can see that this triangle illustrates the buyers repeatedly pushing at the resistance level of the upper trendline until it breaks. The determination of the buyers is shown by the fact that the price falls less each time before another attack. It’s basically showing that the buyers are being aggressive and bashing away on the resistance level until it fails at the breakout. That is why it would be unusual for it to break out to the downside.
The completion of the ascending triangle pattern is considered to be when the price closes on a breakout above the horizontal upper line. Again, the volume will provide confirmation of the strength, and you would expect it to increase noticeably on the breakout, particularly as this is an upward move. The price may retrace on light volume back to the upper line, which in accordance with technical analysis principles has then become a support.
Ascending and Descending Triangles
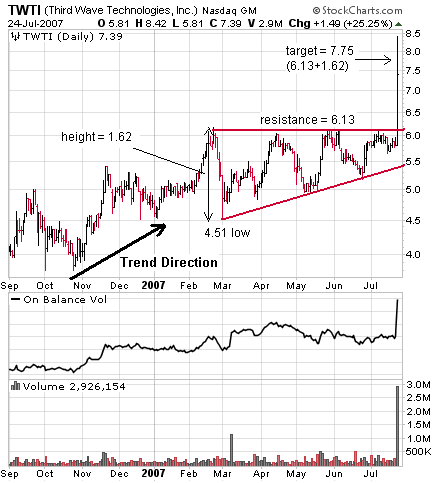
The easiest way to determine a minimum price target is to take the height of the pattern, shown by the vertical dashed arrow at the start of the triangle, and transpose that to the breakout point, as shown. This is an example of using the volatility of the pattern to provide price guidance. Of course, you could also use the previously discussed method of drawing a parallel channel line above the triangle, to provide a slightly different target.
Profit Target – can be measured by adding the height of the triangle to the horizontal resistance line.
Example – A daily chart showing an ascending triangle on TWTI with resistance around the 6.00 level.
As mentioned, the ascending triangle pattern will sometimes occur in a downtrend, when it is called a bottoming pattern. Even then, it is considered bullish. It graphically illustrates the results of the buyers’ continued price pressure on a resistance level, which will usually yield in time and allow the price to increase.
Trading Tip – generally best traded as a continuation pattern that forms in a prevailing uptrend, with the supply line at a psychologically significant round number.