Reversal Patterns Contd.
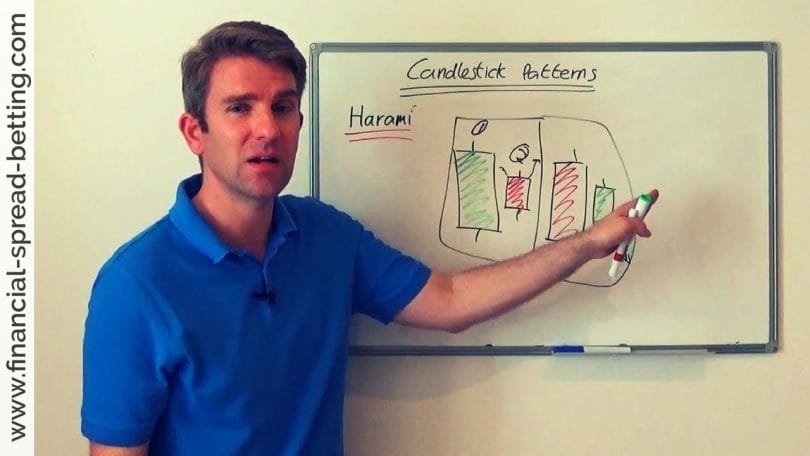
The last two candle reversals we will look at are the Haramis, which means pregnant. This family of patterns includes the Bearish Harami, the Bearish Harami Cross, the Bullish Harami and the Bullish Harami Cross. Please note that these are short-term trading patterns. We’ll look at the Bearish Harami, and then explain the differences with the others.
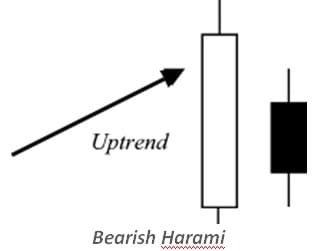
The Harami happens in two bars with the first bar bar being larger than the second bar i.e. bar two will have a lower high and higher low in relation to bar one. It signals that the market has contracted and is waiting for a breakout.
In some ways, the Harami is the the opposite of the engulfing – the second candlestick is within the previous real body. It’s called Harami (pregnant) because of the appearance, a mother and a baby bulge alongside. The first day is a long day in the direction of the trend. But the next day starts lower and only trades in a small range, with a lower close, which points to weakness in the trend. Look for lower volume on the second day as a further reversal sign. The weakening of the trend makes traders consider selling their holdings, reinforcing the reversal.
The Bearish Harami Cross is similar, except the second candle is a Doji. This emphasizes the faltering in the market. Effectively the trading is paralyzed at the current level, and the bulls are losing their power.
The bullish versions of the Harami are just the same, but in the opposite direction – coming in an established downtrend and indicating a bullish reversal.
Harami patterns mean indecision in the marketplace. The market is trading in a narrow range and is unlikely to continue trading within this tight range meaning that a breakout may happen either on the next bar or a little while after. A way to trade this is to buy the break of the high on bar two or open a down bet on the break of the low on bar two (or you could place an OCO order to take advantage on a break either direction).
There are several other two candle patterns, but these are major ones that you will see regularly.
There are a couple of three candle pattern forms that you should know. There are many others, and patterns with more than three candles, but the basics will get you a long way. In fact, some of the three candle patterns are recognizable as two candle patterns with a third candle as confirmation, in the direction of the reversal.
One of the pattern forms is the ‘star’ which comes in various guises. The principle behind the star is that it is gapped from the candles either side, which is what makes it look like a star in the heavens – at least for the bearish reversal of an uptrend. Here is the basic Evening Star –
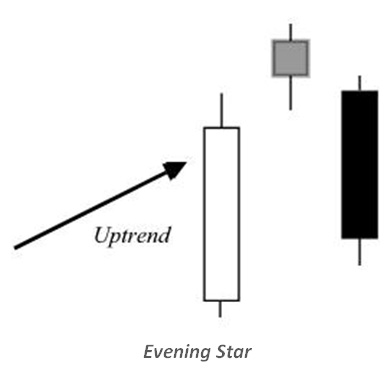
The star candle, in the middle, can be either color, so I’ve shown it as grey.
The first candle is strongly in trend with a long white day, and the second day opens with a gap – this is a necessary part of the pattern, and starts the star formation. But the second day proves to be indecisive, and the third day gaps down and continues down. You can see that the first gap isn’t a strong sign, but an exhaustion gap. Some people don’t require a gap down to call the pattern valid, and others insist that the third candle closes more than halfway down the first candle’s body, as shown.
Variations on the Evening Star include the Evening Doji Star, with a Doji in the centre, which is a stronger reversal pattern. The Bearish Abandoned Baby is a special case of this where the Doji is totally gapped away from the surrounding candles including their shadows – it’s rare to get this extreme. It’s also possible, though very rare, to get a Bearish Tri Star, where all three candles are Doji. If you see this, it’s a good idea to check the trading volumes to make sure that the pattern is not some mistake.
Bullish patterns are the reverse of the bearish ones, and include the Morning Star which is a bottom reversal at the end of a downtrend, corresponding to the Evening Star. Others equivalent to the bearish patterns are the Morning Doji Star, the Bullish Abandoned Baby, and the Bullish Tri Star. These last are rare, so you just need to concentrate on the main Star formations.
The last three candle reversals I will describe are the Three Black Crows and the Three White Soldiers. You don’t see these very often, but you should watch out for them. Here they are –
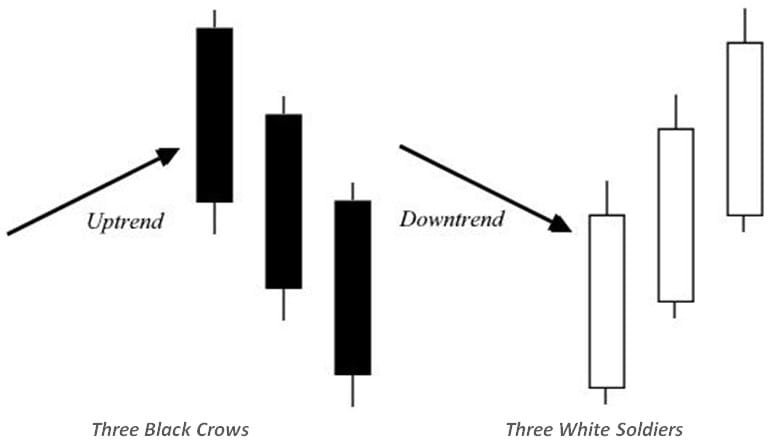
Each day it seems that the price wants to go back to the old trend, as it opens higher (in the case of the bearish crows), but the move is confounded by the price action. Although these are the complete patterns, you should watch out for the fourth day to make sure that the reversal continues, as the stock may get oversold (or overbought) by such strong action.