
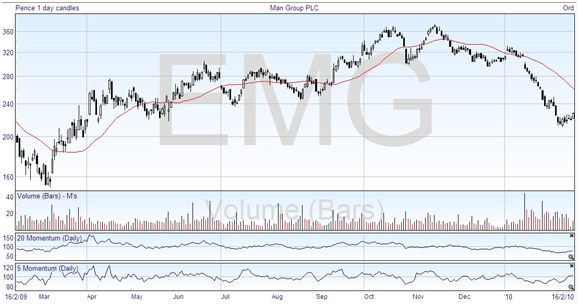
The Momentum Indicator gives us an indication of the rate at which prices are rising or falling. It’s really just what you would expect from the name, and is one of the most basic ways to make an oscillator. You generate it by taking the difference between two prices, the current day and the price X days ago, where X is a number that you can select. Each day you recalculate, so you get a line that goes up and down. The chart below shows two momentum indicators, one based on five days and the other on 20 days.
If the line is above the centre, then that means the price is greater today than it was X days ago. If the price is lower, then the momentum indicator is below the middle line. As you can see, when you only have a small number of days the line moves much more, so once again you must experiment to find the period which suits you and the financial security you’re trading.
If you have an uptrend the indicator will be above the middle, and if the indicator is also rising then the trend is accelerating. If it levels out, the price may still be rising but it’s losing momentum — the rate of increase has levelled off. And if the indicator declines but is still in the upper half, the prices are still rising but at a much reduced rate. As you can see, this means the indicator is leading the price action — it starts declining before the price declines. And you can also see why you must watch out for divergence in the direction of the price line and the momentum indicator, as it gives an early warning of a possible reversal.
Many traders will also consider the crossing of the middle line to be a signal to buy or sell. If the momentum indicator crosses above the middle, that is a buy signal, and crossing back down through the middle line generates a sell signal. Despite this, you must bear in mind that the oscillator is a secondary indication, and you must make sure that the trend favors the trade. You can’t slavishly follow the oscillator and expect to buck the trend, or you’re due for some disappointment. You would only buy when signaled if the market was in an uptrend, and only sell if it was declining.
Now I said previously that oscillators can indicate if the market is overbought or oversold when they get to the extremes. The problem with the momentum indicator is that there aren’t any boundaries marking those extremes, unlike some other oscillators. In this case the best you can do is to visually inspect the indicator, possibly drawing horizontal lines at the top and the bottom of the previous indicator action to see how far it gets. This works fairly well, but you should keep the lines under review and update them if there are any major changes.
By the way, there is a similar type of indicator on most charting packages called the Rate of Change (ROC). This simply has the latest price divided by the price X days ago, and is usually multiplied by 100 to give a reasonable scale. This gives a slightly different profile of line, but if the latest price is less than the reference price from X days ago it will still be below the middle line with either type of oscillator.