
When you are using a single moving average, it can be useful to draw a percentage “envelope” or channel each side of the moving average. This gives you a pictorial representation of where the price may be overextended. A moving average envelope is simply the drawing of a line each side of the moving average, at a distance that is a fixed percentage away. Typically a short term trader may choose an SMA(20) with a 10% envelope, although some traders use as little as a 3% envelope.
Here’s the chart for SMA(20) with a 10% envelope –
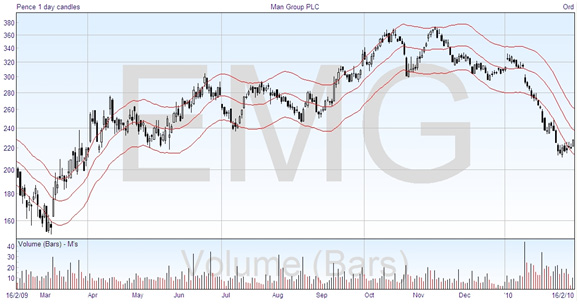
When you look at this, you can see where the price is touching or passing through the envelope. These mark points of market extremes. This particular chart suggests the market is overextended on the left, and the price does indeed come back to the envelope over time. But there is a more effective and informative way of drawing limits on the expected price moves than just using a fixed percentage, and that is by using a technique developed by John Bollinger, which is the next topic.