
As an alternative to looking at volume bars and trying to gauge the buying or selling pressure from that, technical analysts can also use an indicator called the On Balance Volume or OBV. This was developed nearly 50 years ago by Granville, and can be used to confirm the current trend, or by diverging from the price action can suggest a reversal.
Again computers come to our aid in calculating this indicator, as it requires daily addition or subtraction. Depending on whether the price is higher or lower for the day, the day’s volume is added or subtracted from a running total. The total itself depends on how far back you chart, so is not important, but the direction of the OBV is what counts. It should be moving in the direction of the current price trend. If the OBV moves in a different direction, this is called a divergence and signals that the trend may be failing.
Here’s the same chart with the OBV below. Note that with some charting packages you can overlay the OBV on the prices which makes any difference in direction very obvious.
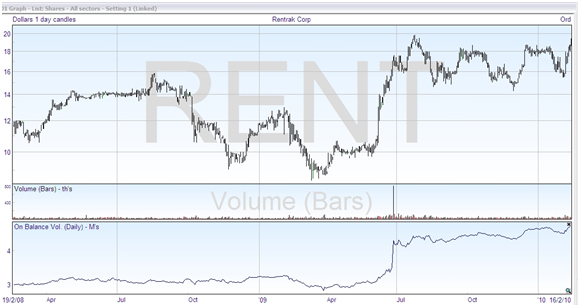
In this chart, you can see that the OBV started increasing between April and July 2009 while the price was still running level. The price duly increased later. Sometimes you will see this, and sometimes the OBV is simply coincident with the price move, and does not provide prior warning. It is interesting that Granville himself missed the bull market of 1982, insisting for years that it was a false move. However, when you do see a divergence between the price and the indicator it is a wake-up call.
Now the OBV has an obvious failing, in that whether the price is ten pounds or a penny above the previous price, all volume will be added, and if below, it will all be subtracted. You may not want it to assign all the day’s trading volume one way or the other, if the margin is not large. So other volume indicators have been developed which try and provide some finesse of these values so that they may be more accurate, as it may be that the OBVs inaccuracies contribute to its failure rate.
The Demand Index (DI) calculates two values, called Buying Pressure and Selling Pressure, and calculates the DI value from these. A trader named James Sibbet developed it, and the actual calculations are complex to do without a computer. The general idea is that if the Buying Pressure is more than the Selling Pressure, DI is greater than zero, which suggests that prices are moving higher. If the other way around, DI is calculated to be negative, or less than zero, which is associated with a downtrend. Again, if the indicator is different from what the price chart is showing, it suggests that something is amiss, and there may be a reversal. The DI usually works out as a more accurate predictor than the OBV.
An alternative is the Chaikin Oscillator, developed by Marc Chaikin. It is an indicator developed on the principles of another indicator, the MACD, calculating the difference between two EMA’s, and it refers to accumulation and distribution, accumulation representing buyers who are willing to pay a higher price and distribution being sellers who will sell for a lower price. As with all oscillators is not necessary to fully understand how it is constructed in order to use it, you simply have to have it available on your charting software and see how it performs with the security that you are interested in. While Chaikin would no doubt regard it as superior to the OBV, because of the way it is constructed it is one step removed from the price chart and can sometimes lead you astray.
If you trade futures you may also come across the Herrick Payoff Index (HPI) which is calculated to include changes in open interest. This indicator uses price, volume, and open interest combined together to determine whether money is flowing into or out of the commodity or underlying.
The idea of these indicator variations is to better display whether the heavier volume is on the bullish or bearish side. The OBV does a fairly good job, and the refinements can fine tune the numbers for a better performance. In practice you have to see what indicator you are comfortable using, after experimenting with different types and values and seeing how they perform on the financial security that you wish to trade. No indicator has been developed which works all the time, and you are simply looking for information to stack the odds in your favour.
If you’re interested in spread betting on futures you should know that the indicators are based on the previous day’s information, because of the way that the futures market works – this can affect how well they work, depending on the volatility. That’s not the only issue with futures, as there are different contracts available with different expiration dates – the indicators are based on the total volume, not the volume for each individual contract. A further issue is that rapidly moving futures contracts can run into limits, as they are not allowed to change more than a certain amount each day – this typically results in light trading, which can distort the volume indicators. If you trade futures, you need to bear these shortcomings in mind, but nonetheless you can get useful information from volume analysis.
Volume and On Balance Volume
Volume and On Balance Volume (OBV) can provide us with important information about the behavior of a stock.
Volume on a price chart shows the level of commitment of the buyers or sellers to the stock while the OBV indicator provides a simple but very effective way to see whether bulls or bears are currently in charge. For example, rising On Balance Volume tells us that the buyers are in control of the stock, whereas declining OBV shows selling pressure.
Example – This daily chart of NGEN shows how volume can affect the behavior of price on a chart. A large change in volume coupled with a chart pattern can give a tip-off as to what may lie ahead in the next few weeks.
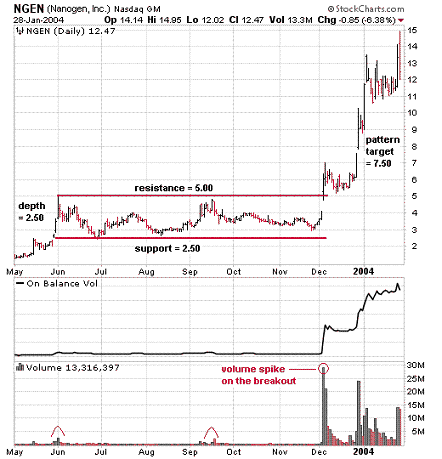
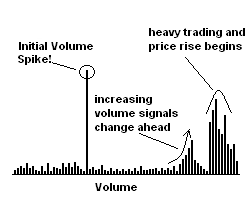
Trading Tip – A breakout accompanied by an unusually large volume can signal the start of a new trend.