
Renko
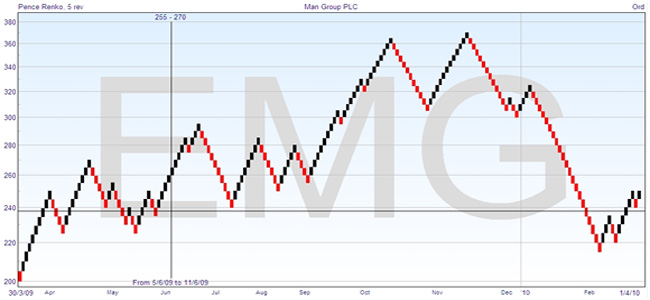
Renko is a Japanese term and simply means brick. The Renko charting system has some similarities to the Three Line Break. The plotting procedure again only requires new lines to be drawn when certain conditions are met, so the timeline is not uniform. In fact, it’s also similar to the point-and-figure, in that there are uniform vertical steps plotted, with the difference that each vertical step is plotted in a different column. For clarity in seeing the principle, I’ve set the vertical step height as five pence, and you can obviously choose whatever value suits your trading.
Renko only make use of the closing price as opposed of the high, low or open – so just the closing price of the period, which could be the day, the week or intraday like the hour. It is suited to markets that trend. So as we have mentioned the values are the closing prices, as there is no provision to include other prices. Every time the price reaches another level, and not before, another block can be drawn. If the price was at 220 and the next closing price was 224, nothing would be drawn (since we have set the vertical step height as five pence). Only when it went up to 225 or higher, would you draw the next block. If it went up to 235 all in one day, you would draw three blocks, but even then they would be drawn corner to corner as shown and not stacked vertically.
Renko Charts
Obviously, for a reversal the threshold value is one block below the bottom of the last one, otherwise nothing could be drawn. Depending on the value you take for the vertical step, the chart will highlight strong trends but ignore brief reversals in price. The basic trading strategy would be to buy or sell after you have seen the first reversal block. The system prevents you from trading on every minor fluctuation in price, and gives a smoothing function to the trend. The selection of the value is key to preventing you over trading on the one hand, but not leaving it too late to jump on a trend on the other hand.
In this case you would open a long position on the first black box and exit (or go short) on the first red box. The red box in this respect is like a trailing stop, protecting profit. Let’s say you open a long trade on that first black box but the trade doesn’t move in your favour and the next box is red. You would then exit that trade at that point. You have suffered a small but calculated loss. Next, you again go long on the first black box (risking say, just 2% of your capital), this time the next box is also black and you keep getting more and more black boxes. Now you are trading a trend so you would allow your profits to run although you also need to protect this profit. After some more black boxes you get a first red box so you now exit the trade. Granted, the next box could have been black but you can’t rely on hope and have to follow the trading rules. It is also worth pointing out that Renko might not give you a new box every day since the closing price has to close above the size of the previous box – this means that you might get, say, 6 days where the closing price stays within the range of the present box size. Renko in this respect encourages a patient and disciplined trend-following approach. Since you also know the box size, you also know your risk.