Now for reasons I’ll go on to explain in the next section, often support and resistance reverse their roles, once they are penetrated or ‘broken’. If the price goes up through resistance by a good way, then that resistance level becomes a support level when the price comes back down. Here’s an illustration of that.
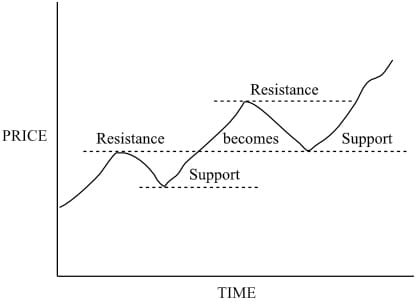
And in the same way, when you have a downtrend, often the support which gets penetrated becomes a resistance next time the price rises, as you can see here.

These are just drawings, so you may be doubting that it occurs in real life – after all, it seems somewhat surprising and just a bit too strange. Well, here is an actual share chart which shows the real thing. The resistance level of 26.6 in July becomes a support in September and again in November and December.
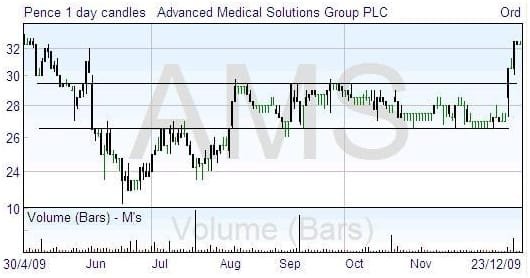
On this graph you can also see how the support and resistance are constantly touched and bounced off when the stock is trading sideways from September through December. It is uncanny how often you will see this type of price movement, almost as if the support and resistance levels are actual obstacles, such as the walls in “Breakout”, which only give way and allow the price to go through after being battered for a time!
The next section gives a plausible explanation of why this could be, although I will admit that there is in reality no one easy cause and there are a complexity of emotions and motives going on with many of the market participants. The explanation presents one simple easily understood reason for the observed behavior, so is a good way of thinking about it. Incidentally, one of the reasons for looking at different time periods of charts is precisely because there may be historic levels that could become support or resistance in the current timeframe, as they do tend to show up again, sometimes after several years.
For support and resistance to change their roles, the price has to go well past the level, called the amount of penetration. Some people use 3% penetration as a guideline. This is because the price might just penetrate but come back into the pattern, as trading isn’t that precise. Whether it is enough can also be influenced by how long the price goes beyond the boundary, as a sharp deviation which quickly returns may not signal a change, whereas a smaller penetration which lasts for a week could be more significant. The underlying principle is that for a reversal of roles, the market participants have to change their minds, and think that they had it wrong. This requires a distinct and positive penetration that they can believe in. The further away it goes, the more likely they are to think this.