Symmetrical Triangle
Here’s the symmetrical triangle again, with a few more lines added for discussion. It’s a neutral sort of shape, so it’s usually neutral in effect, just giving a pause to the current trend before it continues again. You can see it in either an uptrend or a downtrend, and the chances are that the same trend will resume when the price leaves the constraining lines of the triangle. If the trend had been down in the diagram above, then you would reasonably expect a bearish continuation.
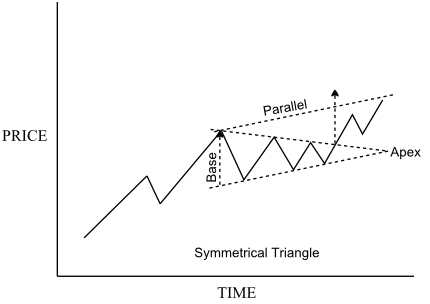
Lines have been added to illustrate the parts of the triangle. The vertical line at the start of the triangle, called the base, measures the height of the triangle pattern. The point in the future where the two lines meet is the apex of the triangle. The triangle is really just made up of two trend lines which converge at the apex. As you need at least two points to draw a trendline, you are able to draw it after the first four points, and that is when you may start to suspect that you have a symmetrical triangle pattern.
I’ve shown a couple of additional points of reversal on the triangle before the trend resumes, and this is how you will frequently see it – with a total of six points touching and being bounced back by the triangle. The third point on each line serves as a confirmation of the trendline, and also gives you an expected time for the breakout to occur, after five oscillations within the triangle.
As you can see, this pattern must resolve with a breakout within a certain time, as the price is getting squeezed down to the apex. You will usually find that the breakout happens in an area between two-thirds and three-quarters along the length of the triangle – the diagram shows about two-thirds. The length of the triangle is considered to be the distance between the base and the apex. As soon as you have four points and can draw the symmetrical triangle, you can measure how far along the breakout should happen. It is rare that the price will not breakout by the three-quarters mark, but in exceptional cases the triangle pattern may fail and the prices just start to drift.
The triangle is a very neat pattern, combining price and time in a close relationship. The trendlines which give the price boundaries of the pattern also serve to limit the timescale.
The triangle pattern will be completed and the signal given when the price breaks out and closes outside the triangle. Usually this will be in the original direction. You can apply the same criteria to this as to any penetration of a line, which is that an intraday penetration is not usually significant if the price returns, and some people like to see the price stay outside the line for two days. The penetrated line may become a support or resistance subsequently, and the apex level can also be an important support or resistance price level in future movement.
Volume is important to reinforce the pattern. As the price oscillates within the triangle, the trading volume should reduce, and this is generally typical of all converging consolidation patterns. This changes when the breakout happens and you should expect to see heavier volume which shows the resolve of the trend. As has been said before, volume for an uptrend is more important than for a downtrend, in fact an uptrend without good volume should be distrusted. Even though the volume will generally decrease along the triangle, you may see a difference between the volume on the up moves and the down moves, and this should reflect the overall trend. In the case above, the volume should be slightly heavier on the bounces, and lighten off when the price is dipping.
Triangles generally provide obvious and easy ways to develop an idea of the profit potential. The triangle above shows a couple of techniques for price targeting. The first one is to measure the height of the triangle, which is marked base, and project that height up from the breakout point. That’s shown by the two vertical dashed arrows, one marking the base height and the other extended from the intersection of the price and the triangle at the breakout point.
The other method is to draw a channel line parallel to the triangle’s lower trendline, and starting at the top of the baseline, and this becomes a target for the trend. In the diagram above, again this is dashed. This becomes an upside price target, and by extension it can also give you an approximate time target, when the price will reach the parallel line. Often you will find that this is achieved at around the same time as the triangle’s trendlines meet at the apex.