Now we go back to the idea of drawing an angled line on the chart. There are many different ways of doing this and we cover several in this module. As with all technical analysis, there is no one universal right way that will give you trading success all the time. What follows are ways of looking at lines on charts that frequently useful, and you will learn what to look for to find the best ones.
Probably the most well-known angled line follows the trend and provides a boundary for the price. Not surprisingly this is called a trendline. An up trendline is a straight line which slopes upwards and is drawn to touch successive low points in an uptrend. A down trendline is a straight line which slopes downwards and is drawn to touch successive high points in a downtrend.
To be able to draw trendlines, you obviously need to have a trend, and you should confirm this as stated previously – an uptrend has successively higher low points, and a downtrend has successively lower peaks. It takes just two points to draw a straight line, so you can start your trendline as soon as you have these –
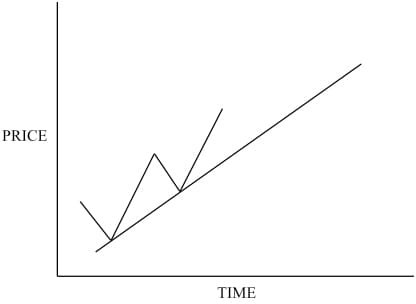
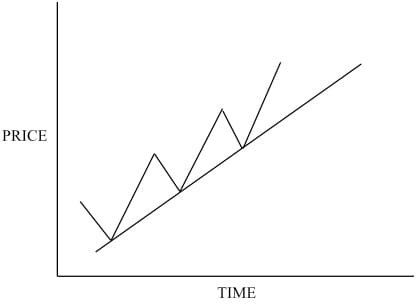
At this stage, it is only a tentative trendline. Many analysts wouldn’t even draw this until the price has gone higher than the previous peak, as shown, which suggests that it is showing a trend. But before you can think of it as a valid trendline, you really need to have a third low point touching it, just like this –
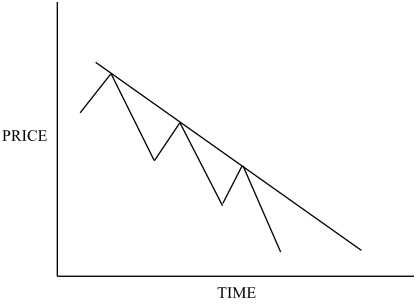
For a downtrend it would look like this. Note that the line is drawn over the top of the prices, connecting the high points –
This is the minimum you need so you can consider it a legitimate trendline. Will you always get the three low points lining up so you can draw a straight line? Of course not, but you would be surprised how often prices do tend to move in this way.
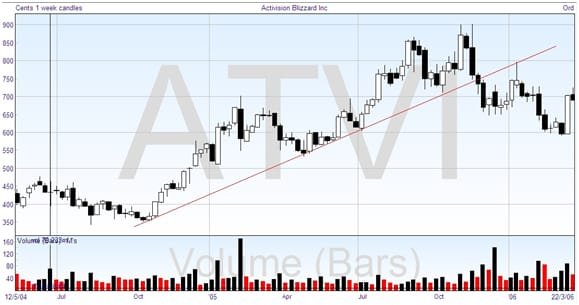
Here’s a chart we’ll come back to later to make other points, but you can see that the long term trendline drawn from October to the low points in May is also touched in July and (nearly) in the next October, and the price does seem to bounce off of it, until the change in trend the following November.