Fibonacci Retracements
Aside from the direct application of Fibonacci ratios to the wave lengths, you can also determine price goals by using the numbers as percentage retracements. You may remember in module three that I spoke about retracements, and mentioned the values of 62% and 38% — actually 61.8% and 38.2%, but that’s far too precise for the way the market moves. The Fibonacci sequence is the basis of these percentages. As mentioned when discussing trends, the smallest retracement is usually around 38%, and the most you should expect is 62%, as if it is greater the trend is probably failing.
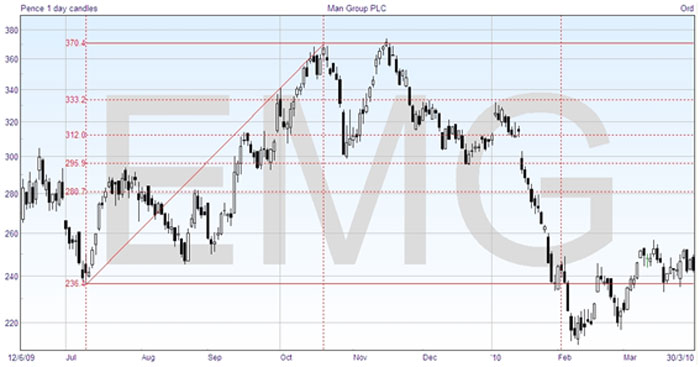
Many charting packages allow you to automatically insert Fibonacci percentage lines, and you should do this from a low point to a peak to see if the percentages play a part in future price movement. Here’s some of Fibonacci lines added to the chart we’ve been following.

You can see how several times the price came to a line, and was reversed. This occurred during the uptrend that I used for drawing the lines, but more importantly it also happened later, and so the lines would have been predictive if you were trading.


Join the discussion