Using One Moving Average
Using one moving average is one of the most fundamental and common basic approaches available for trading. Even with just one, there are still various ways that you can apply it, both for trading signals and to establish a context for other trading systems. It can be as simple as assuming a trading signal when the price crosses the moving average line. This is called the “crossover rule”. If the price crosses above the moving average, you buy; when it goes below, you sell (or place a short trade). You can also include whether the moving average is rising or falling in your assessment of whether to trade.
If you use a short-term average, such as a 10 day, then you will have several crossings, which signal more trades, and if you act on them you may find many false signals, otherwise known as whipsaws. However, the short-term average will give earlier signals, allowing you to capture more of the genuine price moves.
If you use a longer-term average, for example a 50 day, then you will miss out on the first part of any move. This will give you far fewer signals to trade, and the signals you get will be more reliable, with less false trades.
The optimum length of moving average depends on the length of the trends. If you have long trends, then the long term average will be better, as it won’t get you involved in the short-term corrections which a shorter term average may have you trading. But when there is a trend reversal, the shorter average will work to your advantage.
So the basic system is to enter a long trade when the price rises up through the moving average. You can exit the trade when the price line crosses back, indicating a change in trend, or use some other exit strategy. We’ll cover those in future modules.
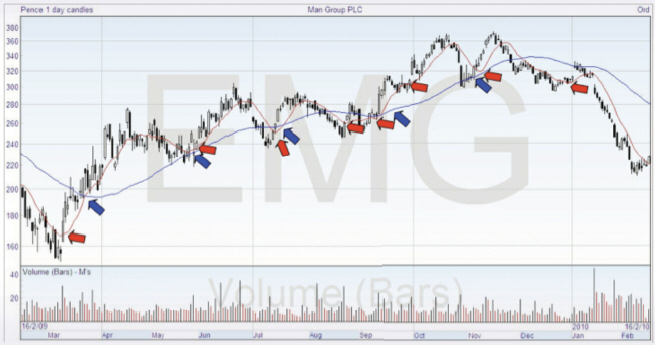
Here’s the chart we looked at before, with an SMA(10) in red, and an SMA(50) in blue. I’ve added some appropriately coloured arrows, showing long entry points, and I could have added several more for red – it would depend on what other qualifying factors, such as for instance the price must cross the moving average for two days before you enter a trade, you decide to choose and include in your trading plan. Certainly the chart shows possibilities for false trading using the 10 day moving average.

False signals or whipsaws, one that do not work out because they reverse direction quickly, can give you many small losses. You cannot avoid whipsaws in general, and particularly with using a moving average to trade, and they are really a problem if the price develops into a sideways market without a clear trend. You need decent trends to profit from this simple technique.
With the exception of the first uptrend, the 50 day moving average signals to enter the trade occur around the same place as the ten-day signals. But if you were to use the 50 day to exit the trade, when the price comes below the moving average line, you would be losing a lot of potential gains. Look for example at the October/November trade, where you enter at around 270, the stock moves to 360, but the price does not come down to touch the blue line until it has fallen to just over 300.
Perhaps halfway between, using an SMA (30), would work better? It’s just that sort of question that you would work to answer as you develop your trading plan, if you choose to use this type of system.


Join the discussion