The wedge pattern can occur in either uptrends or downtrends, and is another type of triangular shape that captures the price movement for a time. It looks just the same as any of the other three (converging) triangles with the single exception that it has a noticeable slant. It is identified as two converging trendlines coming together at an apex, with the apex above or below both of the starting points for the lines.
Wedge Chart Patterns
In the same way as the flag, the wedge tends to tilt in the opposite direction to the trend, or against the trend. Here is an illustration of a falling wedge, which is normally considered bullish and occurs in an uptrend –
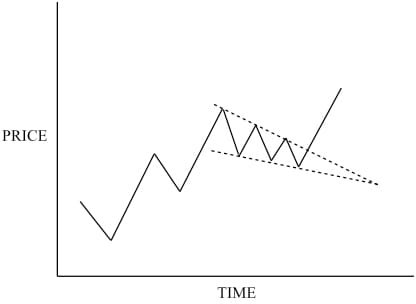
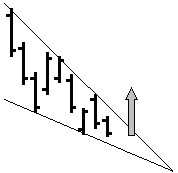
A falling wedge appears in the shape of an elongated triangle that slopes downwards with the price winding lower between two converging trendlines. It is normally found in uptrends as a continuation pattern that slopes against the prevailing trend. In some cases, the falling wedge may materialize at the end of a prolonged downtrend where it can act as a reversal pattern. Volume decreases during the formation of the wedge and should expand on the breakout.
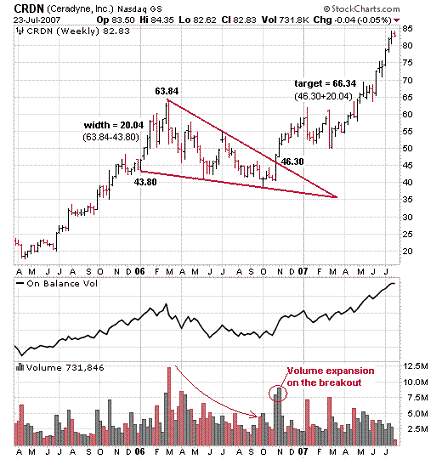
Profit Target – can be measured by adding the width at the top of the pattern to the point of breakout.
Example – This weekly chart of CRDN shows a Falling Wedge in an uptrend.
The wedge pattern can last from one to three months, which is similar to the triangle patterns. When found like this, it is classified as an intermediate length of pattern. It can be a reversal pattern, but is normally seen within an existing trend, and acts as a continuation pattern. You would normally be guided by the idea that a falling wedge is a bullish sign, so on the occasions that it occurred in a downtrend you might look for a reversal.
Here’s the similar rising wedge, which you expect to see as a continuation pattern in a downtrend –
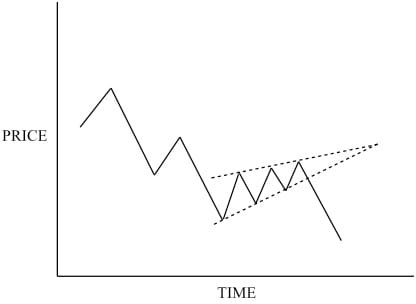
This would usually be a bearish signal, commonly seen in a downtrend, but occasionally as a reversal in an uptrend.
When seen as a reversal pattern, the wedge can be found on every timeframe, from monthly charts to intraday price action. There are two sorts of wedges:
- Falling wedges; they mostly complete after a sharp slump in prices and are bullish.
- Rising wedges; these usually come before a violent downwards reversal. Their bearish bias is all the more pronounced since they are completed after a long period of time following a clear uptrend.
As a general rule, continuation wedges tend to complete more quickly than reversal wedges. Even if a wedge acts a continuation pattern, the basic rules still apply: breakouts happen downwards for a rising wedge. Whether the wedge appears in the middle of a price move as a continuation signal, or at the end of the move as a reversal, a rising wedge is followed by a downtrend and a falling wedge is followed by an uptrend most of the time.
Trading Tip – A falling wedge formation can be traded as a reversal pattern but it is usually better to trade it as a continuation pattern that is created as a result of a decrease in volume in well established uptrends where it can mark the halfway point of a major move.