Price does indeed break support (see arrow), and we are stopped out of half of our long position. After a brief rally, WMT slips back to long-term support between 11 and 12. This is a price level which has been well-tested over the last three years. It is an area which has repeatedly demonstrated control by strong hands. We fully expect support to hold, and so we watch for a buying setup.
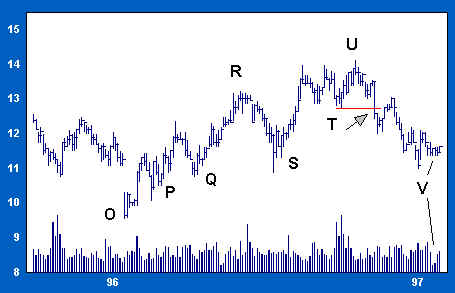
After reversing on increased volume at 11, WMT rallies briefly before settling back on light volume. At V volume dries up noticeably and spread narrows. This quiet trading tells us that selling pressure has been successfully absorbed; any improvement in demand will produce a rally. This is our buying setup, a low-risk point to add back to our long position.
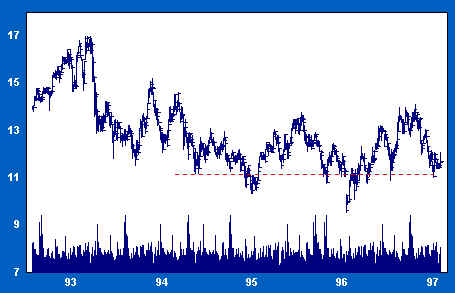
The long-term chart shows that this test of support has placed WMT on firm technical ground and that a very large base has been built over nearly four years of otherwise unremarkable trading. On a relative basis, the stock has been very unrewarding over that time, and weak-handed traders seeking more bullish performance have by now exited. We recognize this process as accumulation. If our assessment is correct, then the potential for the stock is very large indeed. The buying setup at V is an opportunity to increase our commitment to WMT at low risk. We buy back the shares sold earlier on a stop and add more.
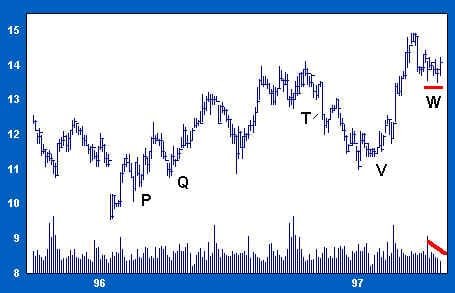
WMT rallies smartly from V (see below), and clears the zone of supply at 14. Note that volume increases off the bottom as the price rallies above 13. Volume off the bottom is generally bullish; a well-bid market from support can climb supply like a vine climbs a trellis.
After reaching 15, price falls back to 14. What has been an area of supply is now support. The backing and filling on the test to W is attended by shrinking volume, an indication that residual supply is being mopped up at the new high.
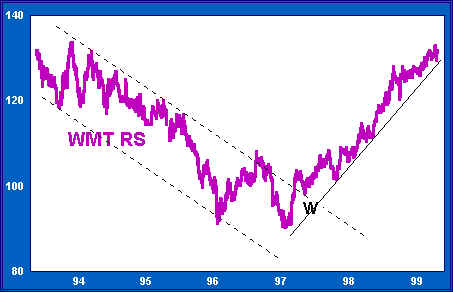
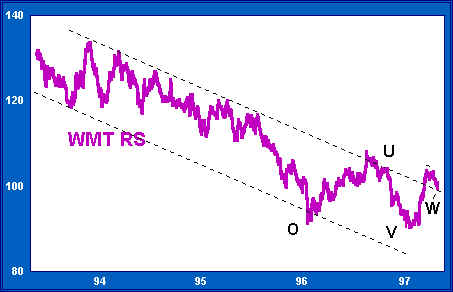
The relative strength chart tells an improving story. After testing relative support at V, RS improves dramatically, again rising above the supply line of the downtrend channel. At W, RS returns to test the supply line. If RS can hold here, the generally improving trend may continue.
Volume on the rally from V increases. Rising volume on rallies tells us that accumulation is giving way to markup. Now, with the stock resting on support and price-volume indications positive, we finish accumulating our own line by adding to our long position at W.
Upside targets for WMT are substantial. The one-half point chart below shows a first and most conservative count of 27 columns taken across the 11 1/2 row. This count provides a first target of 23 (13 1/2 points from the low point of 10). A second count across the 12 row indicates a target of 34 (24 1/2 points from 10) to 36 (from 12). The most aggressive target is estimated by counting 75 columns across the 14 row. This provides a count of 37 1/2 (75/2=37 1/2). The target zone ranges from 47 (37 1/2+9 1/2=47) to 50 1/2 (37 1/2 + 13).
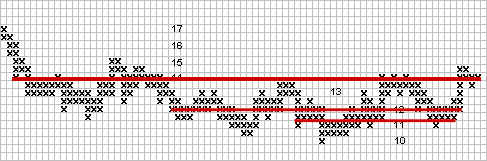
Note that targets are taken, beginning at lower levels to the right and moving up and to the left of the point & figure chart as targets are expanded. Each of these target areas was respected as the stock rose in a two-year bull move, as you can see from the updated chart of WMT below.
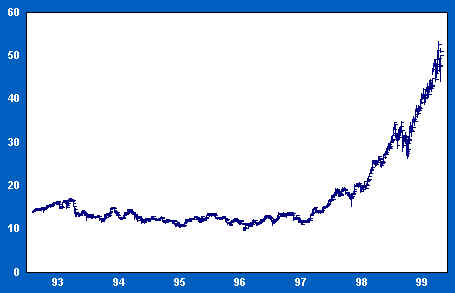
A clear trend of improving relative strength developed in WMT as price moved to its long-term target of 50 plus. As WMT’s nominal price reached its highest target, RS recovered all of the loss recorded from 1993 to 1997.