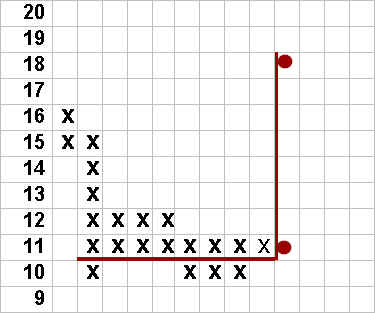
Additional accumulation on the retest of support at 10 has broadened the row of x’s at the 10 1/2 level, requiring us to adjust our point & figure counts. The point & figure chart below now indicates 13 as our first objective. Again, we have used one-half point reversals to build our chart. The count is taken along the solid row of x’s at 10 1/2. A price objective of 13 recovers one half of the decline from 16 1/2, a normal recovery, and clears supply between 11 1/2 and 12 1/2. Everything now points to a rally; any further indication of weakness will prompt us to reassess our bullish analysis.
GE has been basing for nearly one year, during which there has been consistent evidence of accumulation by strong hands. Generally, the longer the period of accumulation, the higher the potential price target.
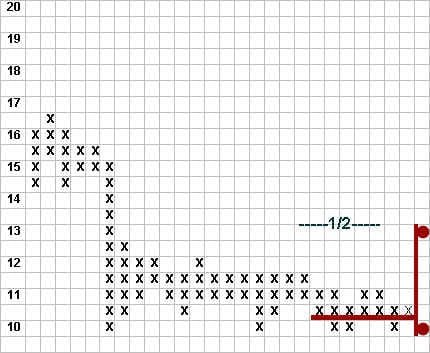
In the chart below, a count of 21 x’s at 10 1/2 provides a count of 10 1/2 points (21 x 1/2 = 10 1/2). GE has the potential to double.
Our approach is to assume the most conservative price objective first, adding further objectives as future price action warrants. Nevertheless, the higher target of 20 will color our longer-term strategy from the outset. Given higher objectives, we should be willing to add to our position as the stock passes benchmark objectives along the way.
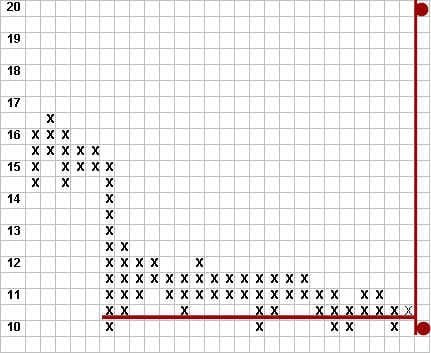
A one-point chart over the same period indicates a target of 18 if the count is made from the solid row of x’s at 11. We conclude that a reasonable long-term target for GE, based on point & figure analysis, is between 18 and 20.