
Rising strength-following markets are the best of times. If contrarian markets are a time of tilling and sowing, then strength-following markets are a time of harvest.
When both prices and the Spread are rising, the most profitable strategy is to buy and hold the strongest stocks. During these periods the trend is strong, and the best performing stocks attract a large and enthusiastic following. Avoid weak issues, even those which have built impressive bases. These stocks are likely to underperform stronger issues.
The signal feature of strength-following markets is that, on average, the higher the RS rank, the better the forward performance. The chart below shows a period during which the Spread rose. The black (lowest) line indicates the average performance of all stocks in the subject universe. The solid blue line shows the cumulative forward performance of the set of all stocks with an RS rank of one (1) or more. The dashed lines show the performance of increasingly highly ranked subsets of strong stocks. The higher the RS rank, the higher the forward performance.
Strength-Following Market
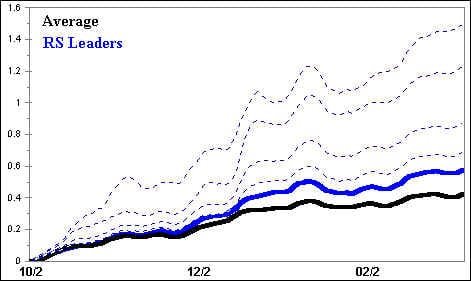
During strength-following markets, the higher the RS rank, the higher the forward performance.
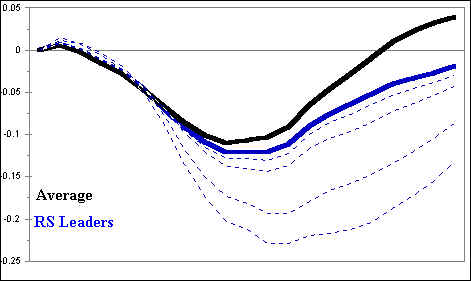
By contrast, the performance of strong stocks during contrarian markets turns the above chart on its head. The chart below shows the performance of stocks with an RS rank of one or better during a contrarian period, as the Spread declines. Again, the benchmark is shown in black. The solid blue line is the forward performance of all stocks with an RS rank greater than one (1). Note that the average strong stock underperforms the benchmark. As RS increases, performance deteriorates further. The dashed lines show the performance of increasingly highly ranked subsets of strong stocks. The higher the RS rank, the lower the forward performance.
Contrarian Market
Ranking Stocks
When traders are in a strength-following mode, the most profitable information is the relative-strength ranking of stocks and groups.Focus on the strongest stocks within the strongest groups.
Once RS is determined for each target in the universe of interest, ranking by RS is easy. Shown below is the rank, from strongest to weakest, of 84 groups as of late August, 1999.
Because the benchmark is always equal to 100, groups above 100 are relatively strong, while those below 100 are relatively weak.
Group RS Ranking
| Group | Rank |
|---|---|
| Semiconductors | 138.65 |
| Oil Drilling | 131.01 |
| Aluminum | 130.70 |
| Computer Systems | 127.31 |
| Oil Service | 122.50 |
| Paper | 120.13 |
| Telecomm Equip | 119.88 |
| Copper | 119.18 |
| Cellular Equip | 117.07 |
| Oil & Gas Explore | 116.80 |
| Bluechip Tech | 115.31 |
| Chemical | 114.81 |
| Asian Equity | 114.50 |
| Biotech | 112.64 |
| Steel | 111.55 |
| Oil – US Integrated | 111.48 |
| Pollution | 111.42 |
| Heavy Equip | 111.10 |
| App & Furn Mfg | 110.25 |
| Personal Credit | 110.01 |
| Manufacturing | 109.54 |
| Trucking | 108.78 |
| Utility Natural Gas | 108.56 |
| Natural Gas | 108.44 |
| Gaming | 108.34 |
| Cellular Service | 108.24 |
| Computer Network | 108.05 |
| International Oil | 106.34 |
| Retail Computers | 105.97 |
| Airfreight | 105.88 |
| Specialty Chem | 105.82 |
| Software | 105.16 |
| Radio Broadcasting | 105.06 |
| Utility Telephone | 104.72 |
| Diversified | 104.49 |
| Autoparts | 103.03 |
| Publishing | 102.74 |
| Newspapers | 101.96 |
| Gold | 101.95 |
| CATV | 101.66 |
| Retail Dept Stores | 100.44 |
| Shoes | 99.78 |
| Railroads | 99.65 |
| Building Products | 98.45 |
| Retail Bldg Prods | 98.27 |
| Media Diversified | 96.90 |
| Latin Amer Equity | 96.46 |
| Tobacco | 96.33 |
| Food Stores | 95.55 |
| Aerospace | 95.50 |
| Restaurants | 94.86 |
| Textiles Apparel | 93.75 |
| Home Builders | 93.61 |
| Money Cntr Banks | 93.04 |
| Food | 92.45 |
| Medical Prods | 92.43 |
| Comp Service | 92.34 |
| Retail Office Supp | 91.58 |
| Computer -PC | 91.34 |
| Utility Electric | 91.22 |
| Household Prods | 90.59 |
| Airline Regional | 90.47 |
| European Equity | 90.21 |
| REIT | 90.02 |
| Beverage | 89.78 |
| Retail Apparel | 89.75 |
| Mortgage | 88.45 |
| Brokers | 87.46 |
| Cosmetics | 87.29 |
| Retail Discount | 87.10 |
| Health Services | 86.54 |
| Bank Regional | 86.28 |
| Property Insurance | 84.99 |
| Thrifts | 84.98 |
| Drug Stores | 84.33 |
| Life Insurance | 83.07 |
| Long Distance Tel | 80.99 |
| Airlines | 80.10 |
| Hotels | 79.84 |
| Internet | 79.30 |
| Autos | 77.97 |
| Comp Peripherals | 74.75 |
| Drugs | 74.52 |
| Mfg Housing | 66.25 |
While not necessary, it is nevertheless useful to normalize RS rank as a percent of maximum and minimum extremes. Entries equal to or greater than 100 (the benchmark) are compared to the maximum entry. The top group in the above list (Semiconductors) is, of course, 100 percent of the maximum entry. The next, Oil Drilling, has an RS which is 80 percent of the maximum, and so on.
Entries below 100 are compared to the minimum entry. To get this calculation right requires that 100 be subtracted from each entry before a comparison is made. So, for instance, the bottom group, Mfg. Housing, converts to a reading of -33.75 (66.25 minus 100). The next group up from the bottom, Drugs, converts to a reading of -25.38, and so on.Then divide each converted entry by the absolute value of the lowest in the list, in this case Mfg. Housing,to arrive at a percent of the minimum. For Mfg. Housing, divide -33.75 by 33.75 and then multiply by 100.The result is 100 (-33.75 / 33.75 * 100 = -100).
A similar calculation is carried out for all other groups with an RS rank of less than 100.The calculation for Drugs is: (74.52-100) / 33.75 * 100 = -75. The Drug group is only 75 percent as weak as Mfg. Housing.
Below is a truncated version of the RS ranking, converted to indicate percent of maximum and minimum RS (allow for rounding errors).
Normalized Group RS Ranking
(Partial)
| Group | Rank |
|---|---|
| Semiconductors | 100 |
| Oil Drilling | 80 |
| Aluminum | 79 |
| Computer Systems | 71 |
| Oil Service | 58 |
| Paper | 52 |
| Telecomm Equip | 51 |
| Copper | 50 |
| Cellular Equip | 44 |
| Oil & Gas Explore | 43 |
| Bluechip Tech | 40 |
| ––– | ––– |
| ––– | ––– |
| ––– | ––– |
| Thrifts | -45 |
| Drug Stores | -46 |
| Life Insurance | -50 |
| Long Distance Tel | -56 |
| Airlines | -59 |
| Hotels | -60 |
| Internet | -61 |
| Autos | -65 |
| Comp Peripherals | -75 |
| Drugs | -76 |
| Mfg Housing | -100 |