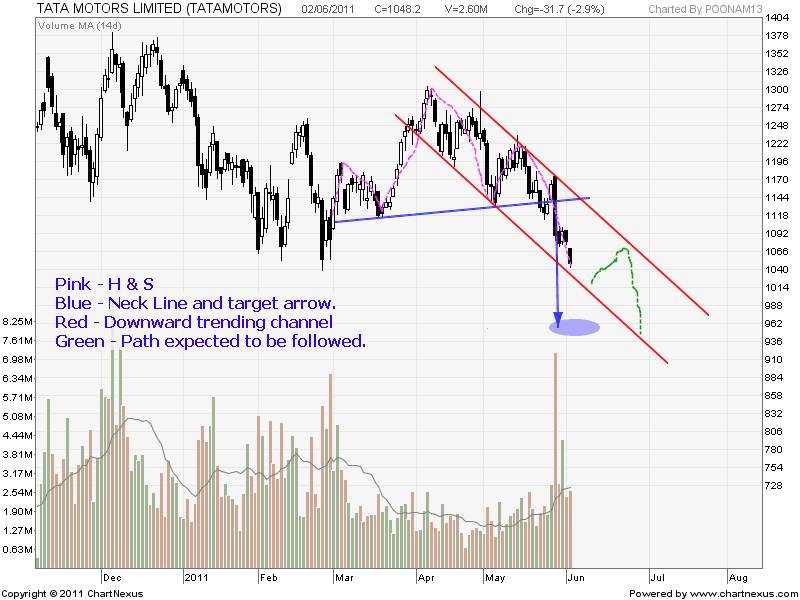
Head and Shoulders Reversal Pattern
A Head and Shoulders Bottom is a reversal pattern that can appear at the end of a major decline where it can signal the end of the downtrend. A good Head and Shoulders Bottom will have the presence of symmetry.
As stated above, this is the archetypal reversal pattern, and others are just variations on this idea. This happens in an uptrend, although there is a similar pattern for a downtrend. The uptrend weakens, and reverses, and the price chart looks like this –

You can clearly see the shoulders, at roughly the same height, and the head peak sticking above. The trend was continuing as expected when it peaked at the left shoulder, and the retracement to take support off the trendline is still complying with expectations.
The head may not be as high as shown here, depending on the weakening of the trend. Certainly, if you see a lessening of volume on the rise to the head as compared to the volume rising to the left shoulder, this might make you watch out for a possible change in trend.
Then it all starts to happen. The decline from the head breaks through the trendline, and also falls below the level of the left shoulder, which in a normal uptrend would provide a support level. There is a weak rally to the right shoulder, with lighter volume evidence that the trend is truly faltering, and as the right shoulder does not get up to the head height, the trend is defeated. The price is now trading sideways, but more is to come.
Reversal Patterns: Bars, Head and Shoulders Reversal
With the fall from the right shoulder to a low point lower than the previous one, the conditions to call it a downtrend now exist – successively lower highs and successively lower lows. What is called the neckline, a line joining the dips between the shoulders, often now provides resistance, as shown in this diagram, to the next rally.
Volume can increase as the downtrend strengthens, but as mentioned above volume on a falling price is not as significant as on the rising price. If there is increasing volume, the price may not even return to the neckline level. The reversal is counted as taking place as soon as the neckline fails to provide support and maintain the sideways trend.
The neckline is often sloping up slightly, as shown, but can be horizontal or even slope down. The dotted arrows are drawn in to show the price objective – the distance from the head to the neckline provides the distance you can expect the price to drop below the violation of the neckline.
The most important thing to look for when assessing whether to trade the pattern is volume – there must be a final sell-off at the Head, marked by higher volume activity followed by firm rising on-balance volume on the Right Shoulder as the buyers resume control of the stock. When interpreted correctly, the Head and Shoulders Bottom is the most reliable of all chart patterns.
Profit Target – can be measured by adding the height between the head and neckline to the point of breakout.


To summarize, the head and shoulders reversal pattern comprises a defined initial uptrend, but the start of the failure of the trend is lighter volume resulting in a lower than expected head peak. The retracement from the head nearly drops to the previous low, or may fall below it, and the next rally cannot reach the head height and has less volume still. The pattern is validated by the next drop decisively passing through the neckline. If it dropped to, or just impinged on the neckline, there would still be a chance that the price was going to consolidate sideways, so this is the final necessary element for completing the reversal pattern.
The breakout of the neckline must occur on sufficiently large volume expansion if there’s to be a successful trend reversal.
Note particularly the importance of volume in indicating the impending reversal. While not a requirement for the pattern, the fact that the volume reduces on each successive peak is a strong warning that the bulls are losing control. In particular, you should see a very light volume on the right shoulder, and it’s good to see the new downtrend reinforced by increasing volume as the neckline is penetrated.
As you can see, there actually is no magic to the head and shoulders reversal pattern. It follows commonsense and what we have already learned about support and resistance properties of trendlines. The description is just that of a progressive change in market sentiment that accompanies the reversal in trend from uptrend to downtrend. Nonetheless, it gives you a shape to look for on the charts which will help your trading.


Join the discussion