Trading Through Charts
Jan 16, 2012 at 12:30 pm in Technical Analysis by
Do you remember that in my article IG Index Gets Better and Better I showed how your currently-in-play trades and orders are shown on the IG Index charts, and alluded to the fact that you can also trade directly from the charts? I told you that I had seen nothing like it on any other spread betting platform.
Well, it seems I spoke too soon because, not long afterwards, ETX Capital sent me an email announcing that their own Trade Through Charts facility would be operational from Monday 16 January. In case you hadn’t noticed, that was today! So my mission today is to make you aware of this hot-off-press feature from ETX Capital; but first let me remind you of the IG Index version.
IG Index Trading Through Charts
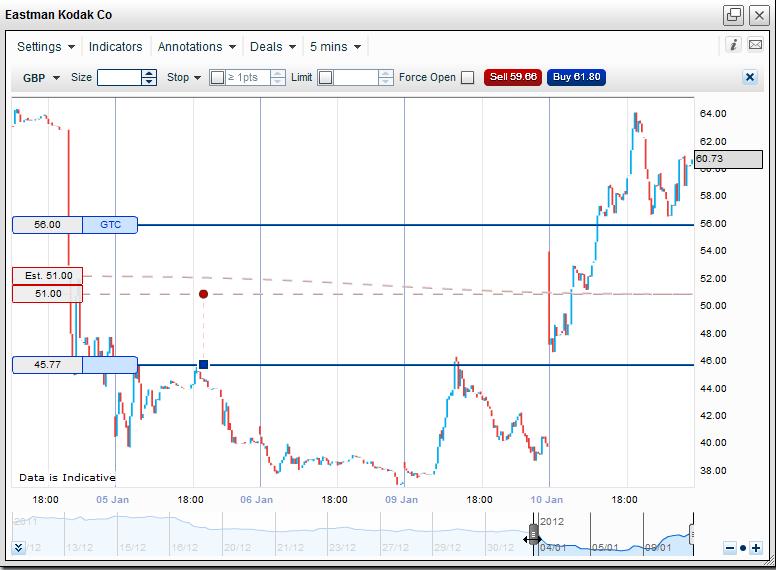
In my article Trade of the Week: Eastman Kodak I presented an IG Index chart — shown again below — that displayed my existing position (lower blue line), my proposed opening order (upper blue line), and the stop orders (dashed red lines) attached to my existing and proposed future positions.

What I didn’t tell you in the Eastman Kodak article is that you can distinguish the actual in-force trades from the future opening orders by virtue of the blue square (on the lower blue line) and the red circle (on one of the stop order lines) that show the date on which the original trade was opened. The future opening order and its associated stop order are not yet dated because the order has not yet executed.
What I also didn’t tell you at the time is that I tweaked the future opening order and its associated stop order by dragging the line(s) up and down on the chart. In this way I could easily adjust the order opening level and the contingent stop distance.
You can see in the picture above how I can easily open a new trade at the current market price via the trade bar at the top of the chart; simply by entering a trade Size, optional Stop and Limit distances, and pressing the Buy or Sell button.
ETX Capital Trading Through Charts
The first thing to say about the ETX Capital offering is that the “trade through charts” feature was not automatically enabled on my account on the launch date, and I had to phone in to request it be enabled. So if you don’t see what I’m showing you below, give them a ring.
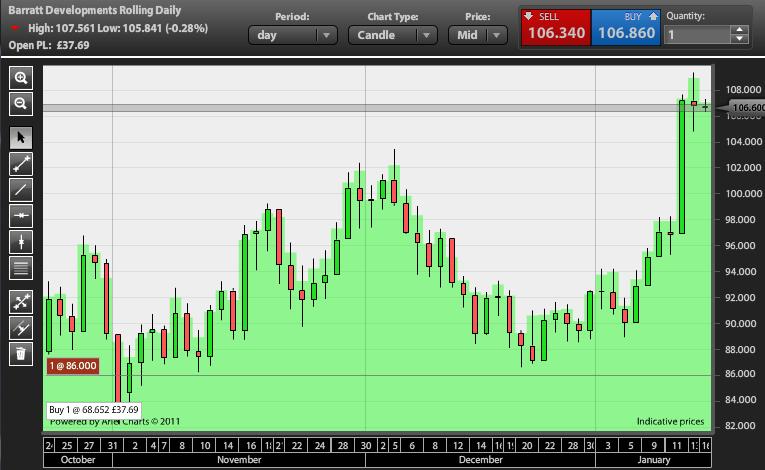
The picture below shows one of the new ETX Capital charts for a profitable position that I currently have in play on Barratt Developments. See at the bottom-left how I have an existing position that I bought for £1-per-point at 68.652 which is currently in profit by £37.69. Notice also how I have a stop order in force at 86 which will stop me out for a guaranteed profit of almost £20. I can drag this stop order higher on the chart, and it will stick at the new level providing I confirm the new placement within a few seconds.

In the upper portion of the chart you can see how I have opted to see the current spread as a grey band so that I have a visual representation of the difference between the current buying and selling prices. Finally, notice how I can buy and sell directly from this chart using the mini trade ticket at the top.
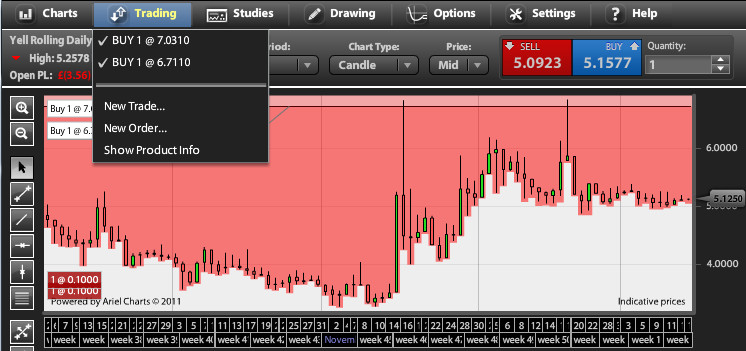
Here is another chart, this time showing my two £1-per-point losing positions in Yell Group. At the top-left you can see indications that my two positions were established at prices of 7.03 and 6.71 respectively, and at the bottom-left you can see indications that I have two stop orders in play at 0.1 — which effectively means no stop orders at all on those positions. In this picture you can see how I can choose which of my open positions to display using the Trading pull-down menu.

Did you also notice how my winning trade(s) in the first picture are shaded green and that my losing trade(s) in the second picture are shaded red? As if I needed reminding!
Do It Yourself
It’s early days and I may have more to say about the “Trading through Charts” facilities in the future, but I wanted to give you a heads-up as of the launch day on ETX Capital. If you’re on the ETX Capital platform, you should now be able to take this feature for a spin yourself. And if you’re on the IG Index platform, you already could.
Are you Aware?
If you don’t yet have an account with ETX Capital, then you should be aware that they are currently offering a £250 in cashback exclusive to FSB readers. Check our Spread Betting Promotions section for details on how to claim.
Tony Loton is a private trader, and author of the book “Stop Orders” published by Harriman House.

