Trade With The Trend
But the key to trading any market in any time frame is TREND. If the trend is up, buy the dips (cycle bottoms); if the trend is down, sell the rallies (cycle tops). Easy to say, but how do you know what the trend is? And how do you know when the trend has changed?
The trend is determined by the trading cycle in the next longer dominant time frame than the one you are trading. If you are trading a daily chart, the trend is established by the direction of the 14 to 25-week cycle in the weekly chart. This cycle is called the primary cycle to differentiate it from the trading cycle being traded. It is thus named to remind you to trade with the trend. For example, if you are trading a 5-minute trading cycle the trend is set by the primary cycle in the 20-minute chart.
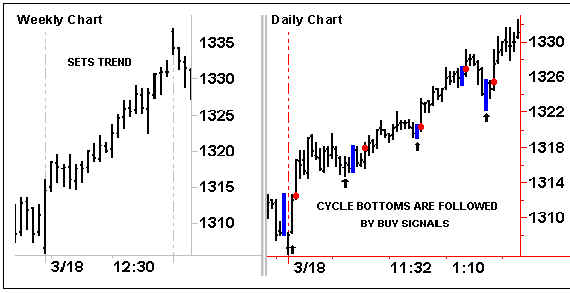
The Direction Of The Primary Cycle Sets Trend For The Trading Cycle
The longer-term chart (weekly or intraday) sets the trend (direction) for trading the shorter-term chart (daily or intraday) based on the dominant cycle in the weekly time frame. When the trend is up, buy the daily cycle bottoms with mechanical buy signals; when the trend is down, sell the daily trading cycle highs with mechanical sell signals.
Chart 10

When the weekly cycle is up, the trend is clearly up for the daily cycle.
However, in this strong market, there is no downtrend into the weekly cycle bottoms, just a sharp retracement into each weekly cycle bottom. A drop below the most recent trading cycle bottom in the daily chart could signal a trend reversal as the 21-week cycle bottoms in the weekly chart.
Fibonacci Retracements
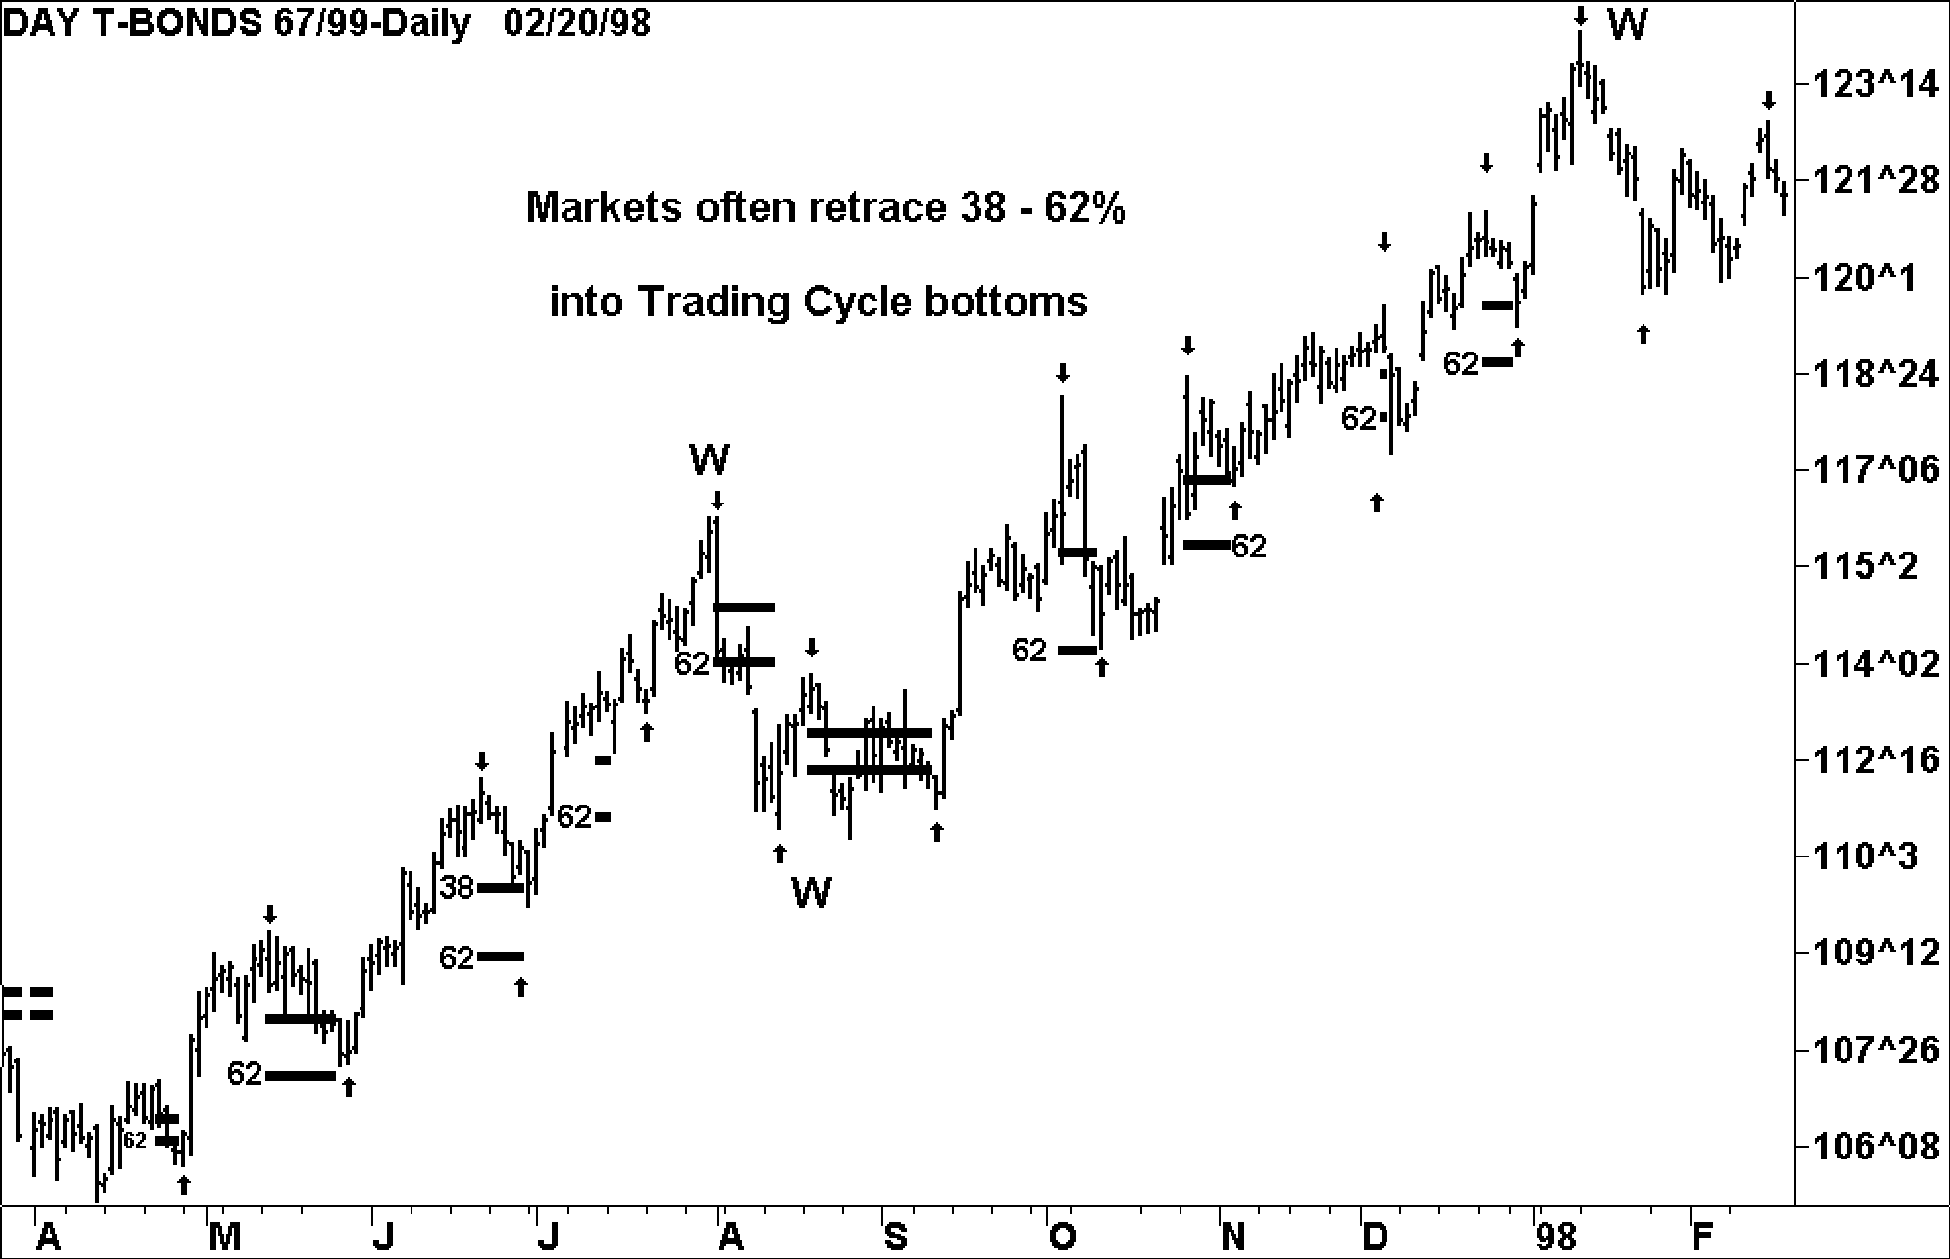
Trading cycles often bottom with a 38 – 62% retracement. The Fibonacci retracements of 38% – 62% are particularly significant as a support range when prices drop into trading cycle bottoms in uptrending markets (and as prices rise to cycle tops in downtrending markets). In a trending market, waiting for prices to retrace into this range before taking a buy signal is often like stretching a rubber band. The further it is stretched, the more powerful the snap back.
The following chart (Chart 11) shows that as the weekly cycles were rising from bottom to top, five of the six trading cycle bottoms retraced at least 38%. Only one retraced more than 62%.
This retracement range is significant in trending markets–in all markets and time frames–and can be used as a component of a Cycle Trading Pattern. But there is more to it.
The ‘W’ shows the weekly cycle tops and bottoms in the chart below. After the two W tops, the trading cycle retracements were significantly greater than 62%. This is a common pattern. Following several 38% – 62% retracements in an uptrending market, a close below a 62% retracement will frequently signify a trend reversal. Therefore, you can use this retracement range to:
- buy trading cycle bottoms in an uptrend within this range;
- consider a close below a 62%–after an extended up move–as a strong warning that a trend reversal is occurring.
Chart 11

In an uptrend, markets most often retrace to at least 38% and not often more than 62%. At trend reversal tops and in the trading ranges that often occur at weekly cycle bottoms, retracements are most often much greater than 62%.
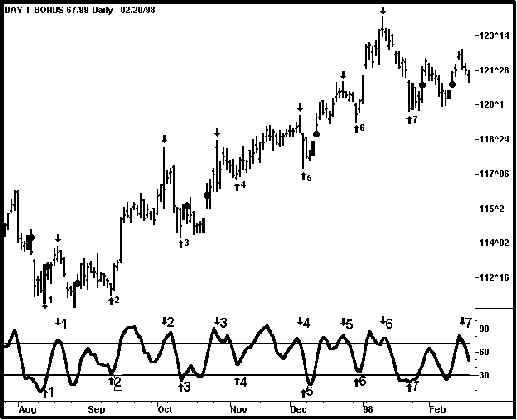
A simple Cycle Trading Pattern illustrated in Chart 11a is –
Cycle Trading Pattern
- A 38-62% Retracement followed by
- A mechanical RSI3M3 setup and entry signal.
Chart 11a

Buy signals combined with 38 – 62% retracements in trending markets.
Most Successful Trades Occur in The Direction Of The Trend
The advantage of trading with the trend is that it is the direction traded by large-scale traders, and the momentum caused by new money entering the market is likely to continue moving prices in the direction of the trend until there is a good reason for it to turn around. The reason could be a fundamental event or simply profit taking. In the next lesson I discuss several ways to determine trend direction.


Join the discussion