

| Take-Over | |
| One company obtaining control of another by obtaining a majority of the voting shares. | |
| T-bonds | |
| Treasury bonds which have a maturity date of more than 5 years. | |
| T-Bill | |
| A T-Bill (or Treasury Bill) is a non-interest paying security, issued by goverenments (particularly the US) to finance national debt. The return to the investor is the difference between the price paid and the price at maturity. | |
| Takeover | |
| When one company makes a successful bid to purchase all of the outstanding shares of another company this is termed a Takeover. | |
| Tap stock | |
| Government stock offered for sale by the Government, sometimes to influence the price. | |
| Technical analysis | |
| Technical analysis attempts to predict the future movement or direction of a share's price based on its past performance. Technical analysts are sometimes referred to as chartists. Is the study of price changes in order to determine the most likely movement of the price in the future. It is a method of evaluating securities by analyzing statistics generated by market activity, such as past prices and volume. The methodology focuses on the ups and downs of the share price and its relative performance, rather than the company's key performance indicators such as profits and EPS. Technical analysis is as such a method of predicting future movements in share prices that focuses on historical trends in price, volume and other variables, as opposed to the fundamentals - such as the earnings and dividend yields - of the shares concerned. Charts are often used as a tool to show patterns that can suggest future trends. As opposed to fundamental analysis. | |
| Tender | |
| An issue of stocks or shares where prospective buyers specify the price they are willing to pay. The shares are then offered to the highest bidders. | |
| Tenth | |
| a specific term used by Finance and Sports traders to indicate the bet is based on a tenth of a point in the underlying market. | |
| Tick | |
| The smallest possible movement (up or down) in the price of a security. A tick (also known as a pip or a point) is the smallest unit of movement in a spread bet. Typically a when spread trading shares a pip is the equivalent of 1 cent (however it for very cheap shares it can be pips can be measured in parts of a cent). Each 1 pip movement will result in either an increase or decrease on your open profit or loss on the trade depending on the direction of the movement. | |
| Tipsheet | |
| The likes of T1PS and Red Hot Penny Shares carry out analysis of the lower reaches of the market and tip the companies/shares they believe will be winners. | |
| TIQ UK100 | |
| Special Trading IQ (available at CMC Markets) index based on the UK100. | |
| Three Black Crows | |
| A bearish technical analysis pattern identified when a share's chart has 3 red candlesticks in a row, each with a lower close then the previous. | |
| Three White Soldiers | |
| A bullish technical analysis pattern identified when a share's chart has 3 green candlesticks in a row, each with a higher close than the previous. | |
| Tokyo Stock Exchange | |
|
The Tokyo Stock Exchange opens at midnight UK time and is the second-largest equity market in the world by capitalisation, with a value of $4.4 trillion. There are almost 2,400 stocks listed on the exchange with the largest sectors being electrical appliances, banks and transportation equipment. Well-known constituents include Nissan, Honda, Toyota, Sony and Sanyo.
In terms of the market indices, the most widely quoted is the Nikkei-225 Stock Average, which comprises the 225 top-rated Japanese companies listed in the First Section of the TSE. It is unusual in that it is a price-weighted index, which means that the higher-priced constituents have a greater percentage impact than lower-priced ones. After the boom of the 1980s the Nikkei went through a prolonged bear market as the economy fell into a severe recession. Numerous false dawns followed but 2003 seems to have marked the turning point, in part due to en extensive package of economic and corporate reforms. Japan is an infrastructure supplier to the world and its economic recovery owes much to the rejuvenation of investment levels in areas such as steel, plant engineering, oil refining, mining equipment and shipping. Linked in to this is the fact that it is heavily-geared into China's economy, with around 50% of the country's exports now going to the Asia/China region. The Nikkei rose strongly in 2005 when it gained almost 50% and despite the volatility of 2006 many expert commentators believe that the country is in the middle of a long-term bull market. Note that just because a stock market closes doesn't necessarily mean that the associated equity index futures contracts can no longer be traded. For example, the Nikkei 225 contracts can be bought and sold on the Chicago Mercantile Exchange for most of the time that the Tokyo Stock Exchange is closed. [Source: Shares Magazine] |
|
| Ton-ups | |
| Specific to sports spreads. Popular market in a variety of sports including cricket and snooker based on the aggregate scores of players who score over 100. So in snooker, a break of 122 contributes 22 to the market. | |
| Top-down | |
| An investment strategy whereby the investor seeks a balance by buying stocks in particular sectors. Such a strategy is basedupon historical and forecasted economic and market trends. | |
| Tracker Funds | |
| Investment funds that simply track a stock market index. | |
| Trade ticket | |
| An on-screen pop-up showing the current live price of a market, allowing you to enter your stake per point and click 'BUY' or 'SELL' to make a trade. | |
| Trading resources | |
| a combination of your cash balance, available credit, open profit or loss positions and initial margin. | |
| Trading tools | |
| aids to spot possible trends. Charts and market news are examples of trading tools. | |
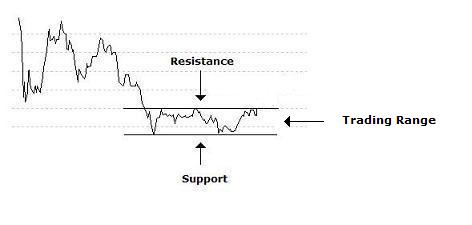
| Trading Range | |
| This relates to a market where the price is range bound by a higher and lower price band. An area between support and resistance levels where buyers and sellers are of equal strength. Usually markets will range trade when there is little news. | |
 |
|
| Treasury bonds | |
| Government bonds (aka as Treasuries). | |
| Trend Line | |
| A technical analysis term used to descibe whose share price is either rising or falling on a clearly defined trend line. Typically if a straight line can be drawn which intersects at least 3 points on a share's chart then this can be called a trend line. When a share's price breaks a trend line this can be a sign that it is about to reverse or break out of it's current trend. | |
| Triple Bottom | |
| A technical analysis term where a share's price has made three almost equal bottoms (price lows) over a relatively short period of time. Traders often try to buy the 3rd bottom with the view that the share's price will rise. The opposite of a triple bottom is a triple top. A triple bottom is similar to a double bottom but is considered an even stronger sign that the share's price will rise from this bottom as it failed at this support level 3 times in a row. | |
| Triple Top | |
| A technical analysis term where a share's price has made three almost equal bottoms (price lows) over a relatively short period of time. Traders often try to buy the 3rd bottom with the view that the share's price will rise. The opposite of a triple bottom is a triple top. A triple bottom is similar to a double bottom but is considered an even stronger sign that the share's price will rise from this bottom as it failed at this support level 3 times in a row. | |
| Triple Watching | |
| A quarterly event whereby stock index futures, stock index options and options of individual stocks expire. The event usually results in increased market volatility. | |
| TSE | |
| Tokyo Stock Exchange | |
| Turnover | |
| The sales of a company. May also be referred to as revenues. | |